Explore a sample problem to see how Dynatrace helps you stay on top of modern, dynamic cloud environments, automatically suppress alert noise, and pinpoint precise root cause. Keeping services running and teams working efficiently and proactively is critical. Here, Davis AI analyzes billions of dependencies to identify the root cause of an issue in the CheckDestination service, so teams no longer have to invest time and effort on finding problems and instead can pro-actively address issues faster and free time for innovation.
Simplifying cloud complexity with automatic and intelligent observability
Summary
Purepath
Service flow
Backtrace
Service details
Method hotspots
Response time analysis
Root Cause
Next
Previous
Root cause
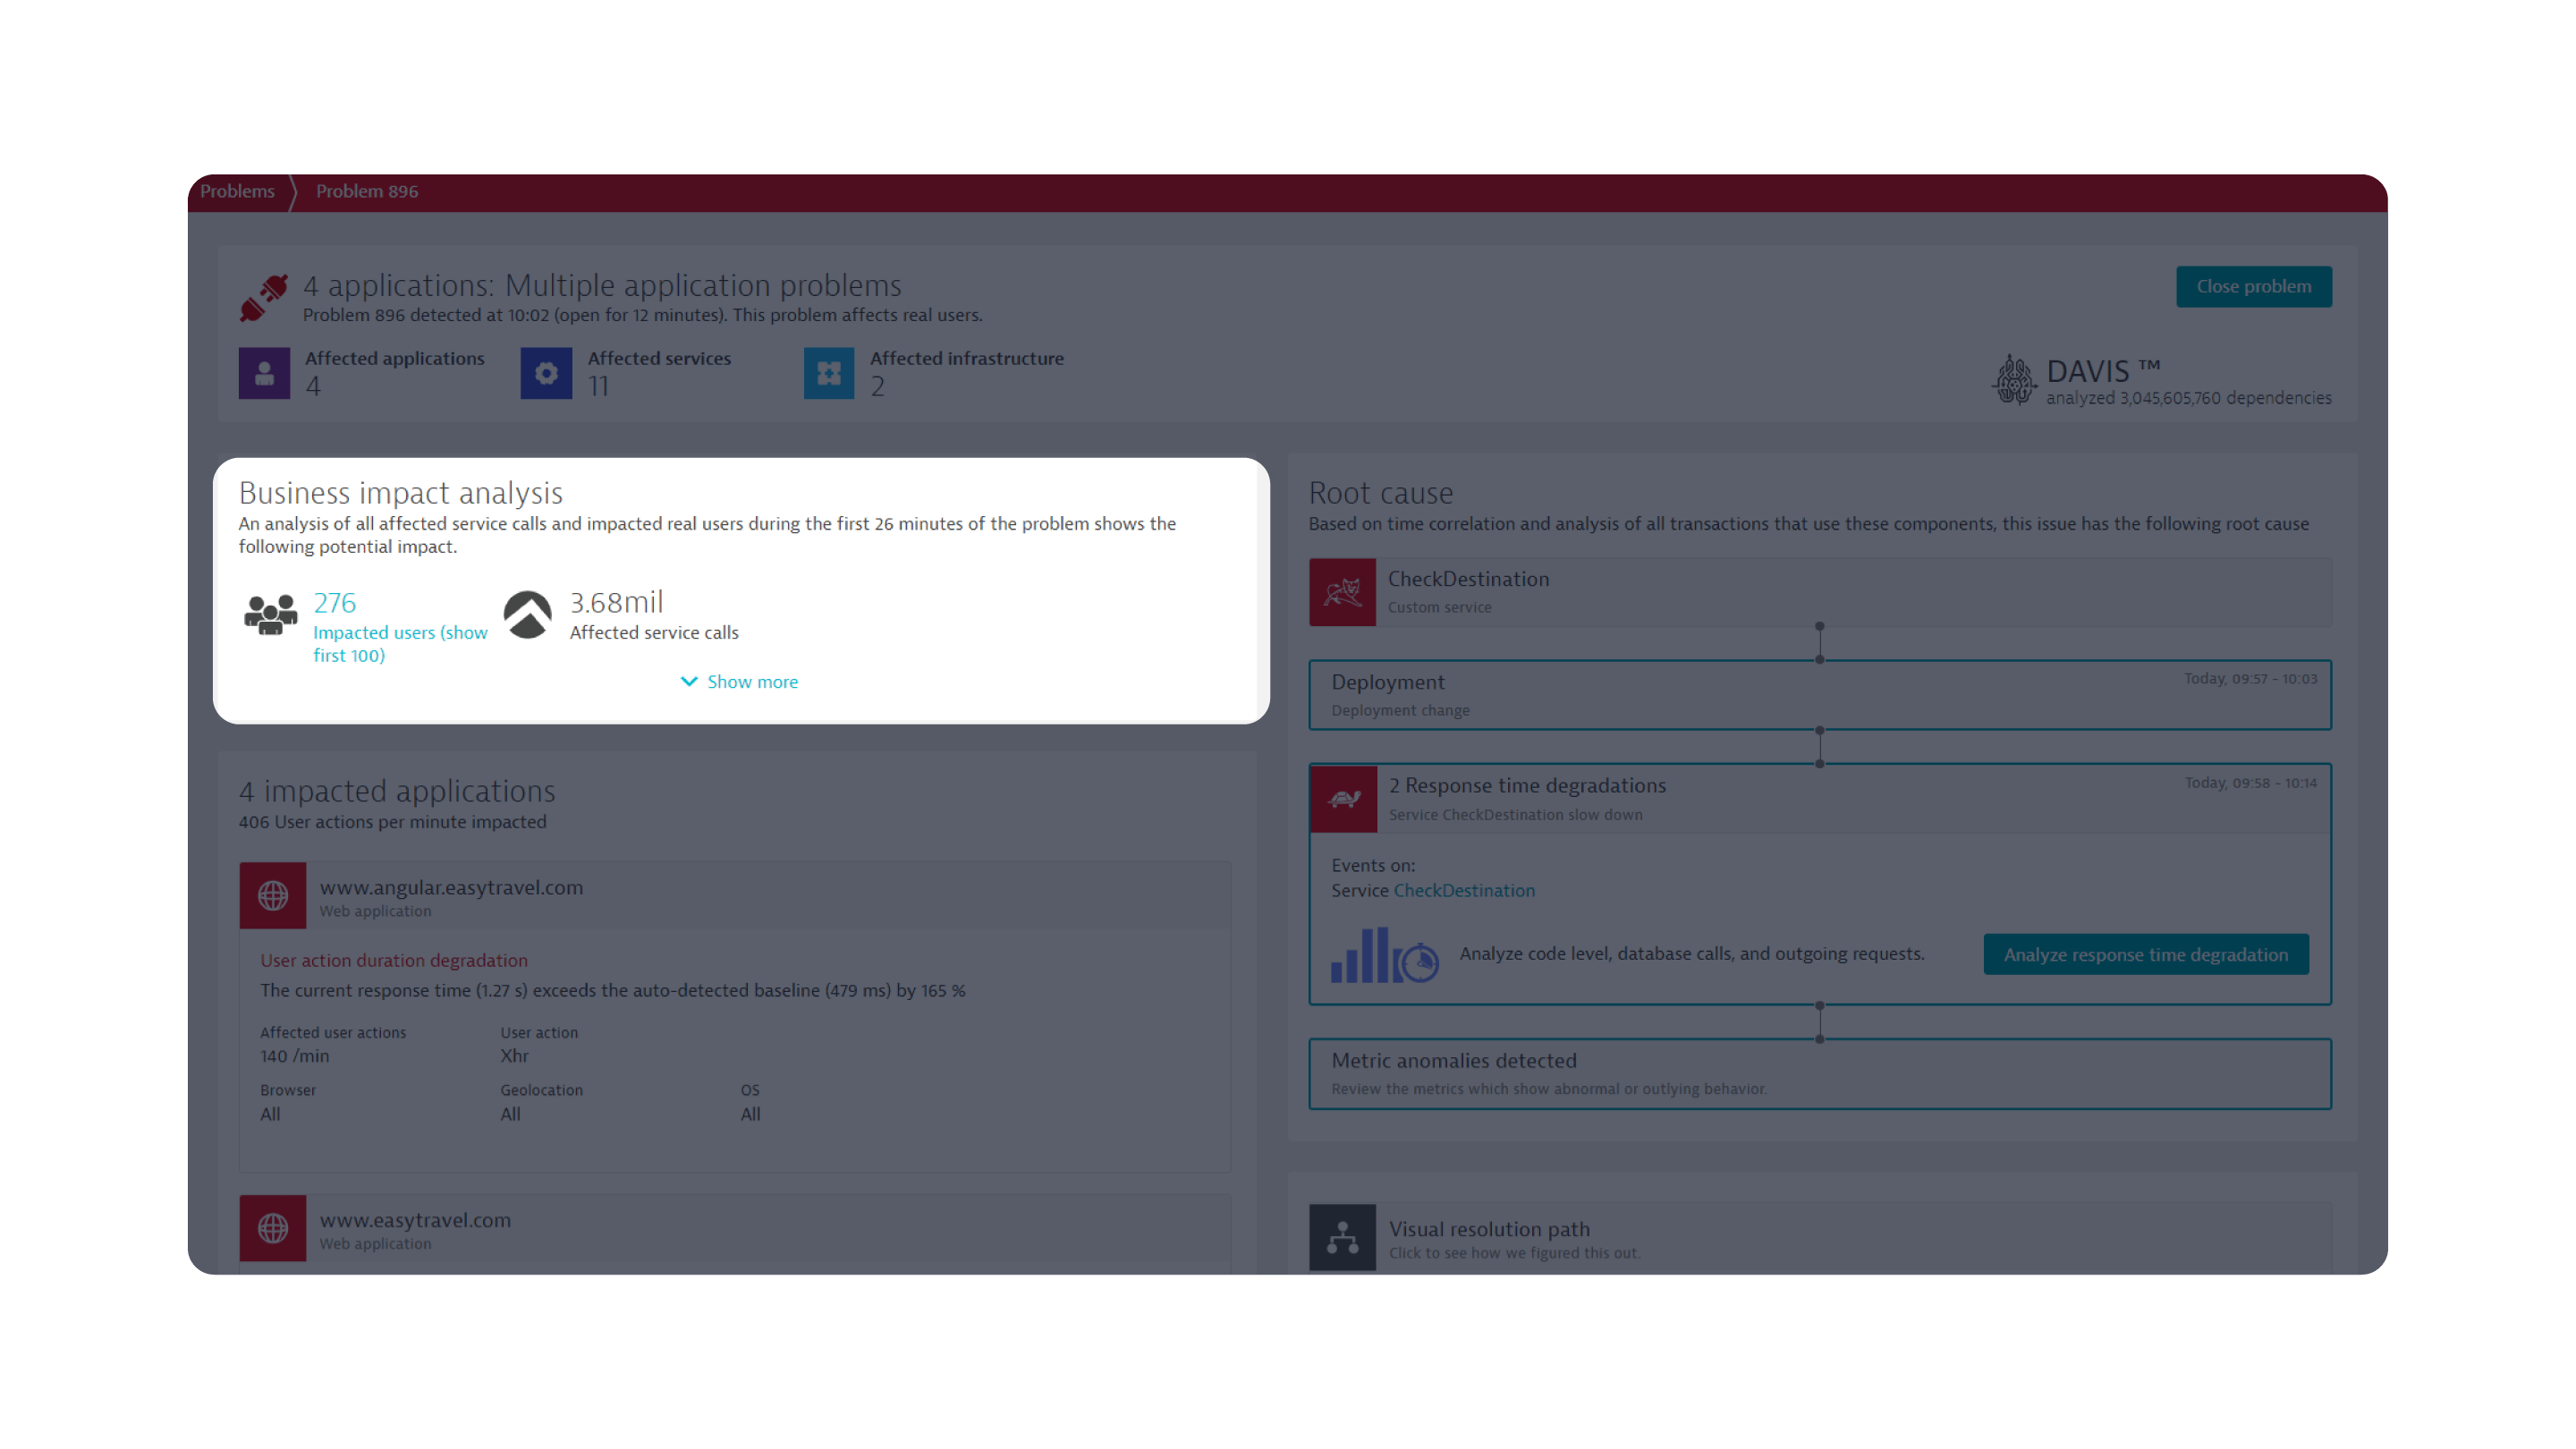
Identify all impacted users and visually replay how they’re experiencing the problem.
1/6
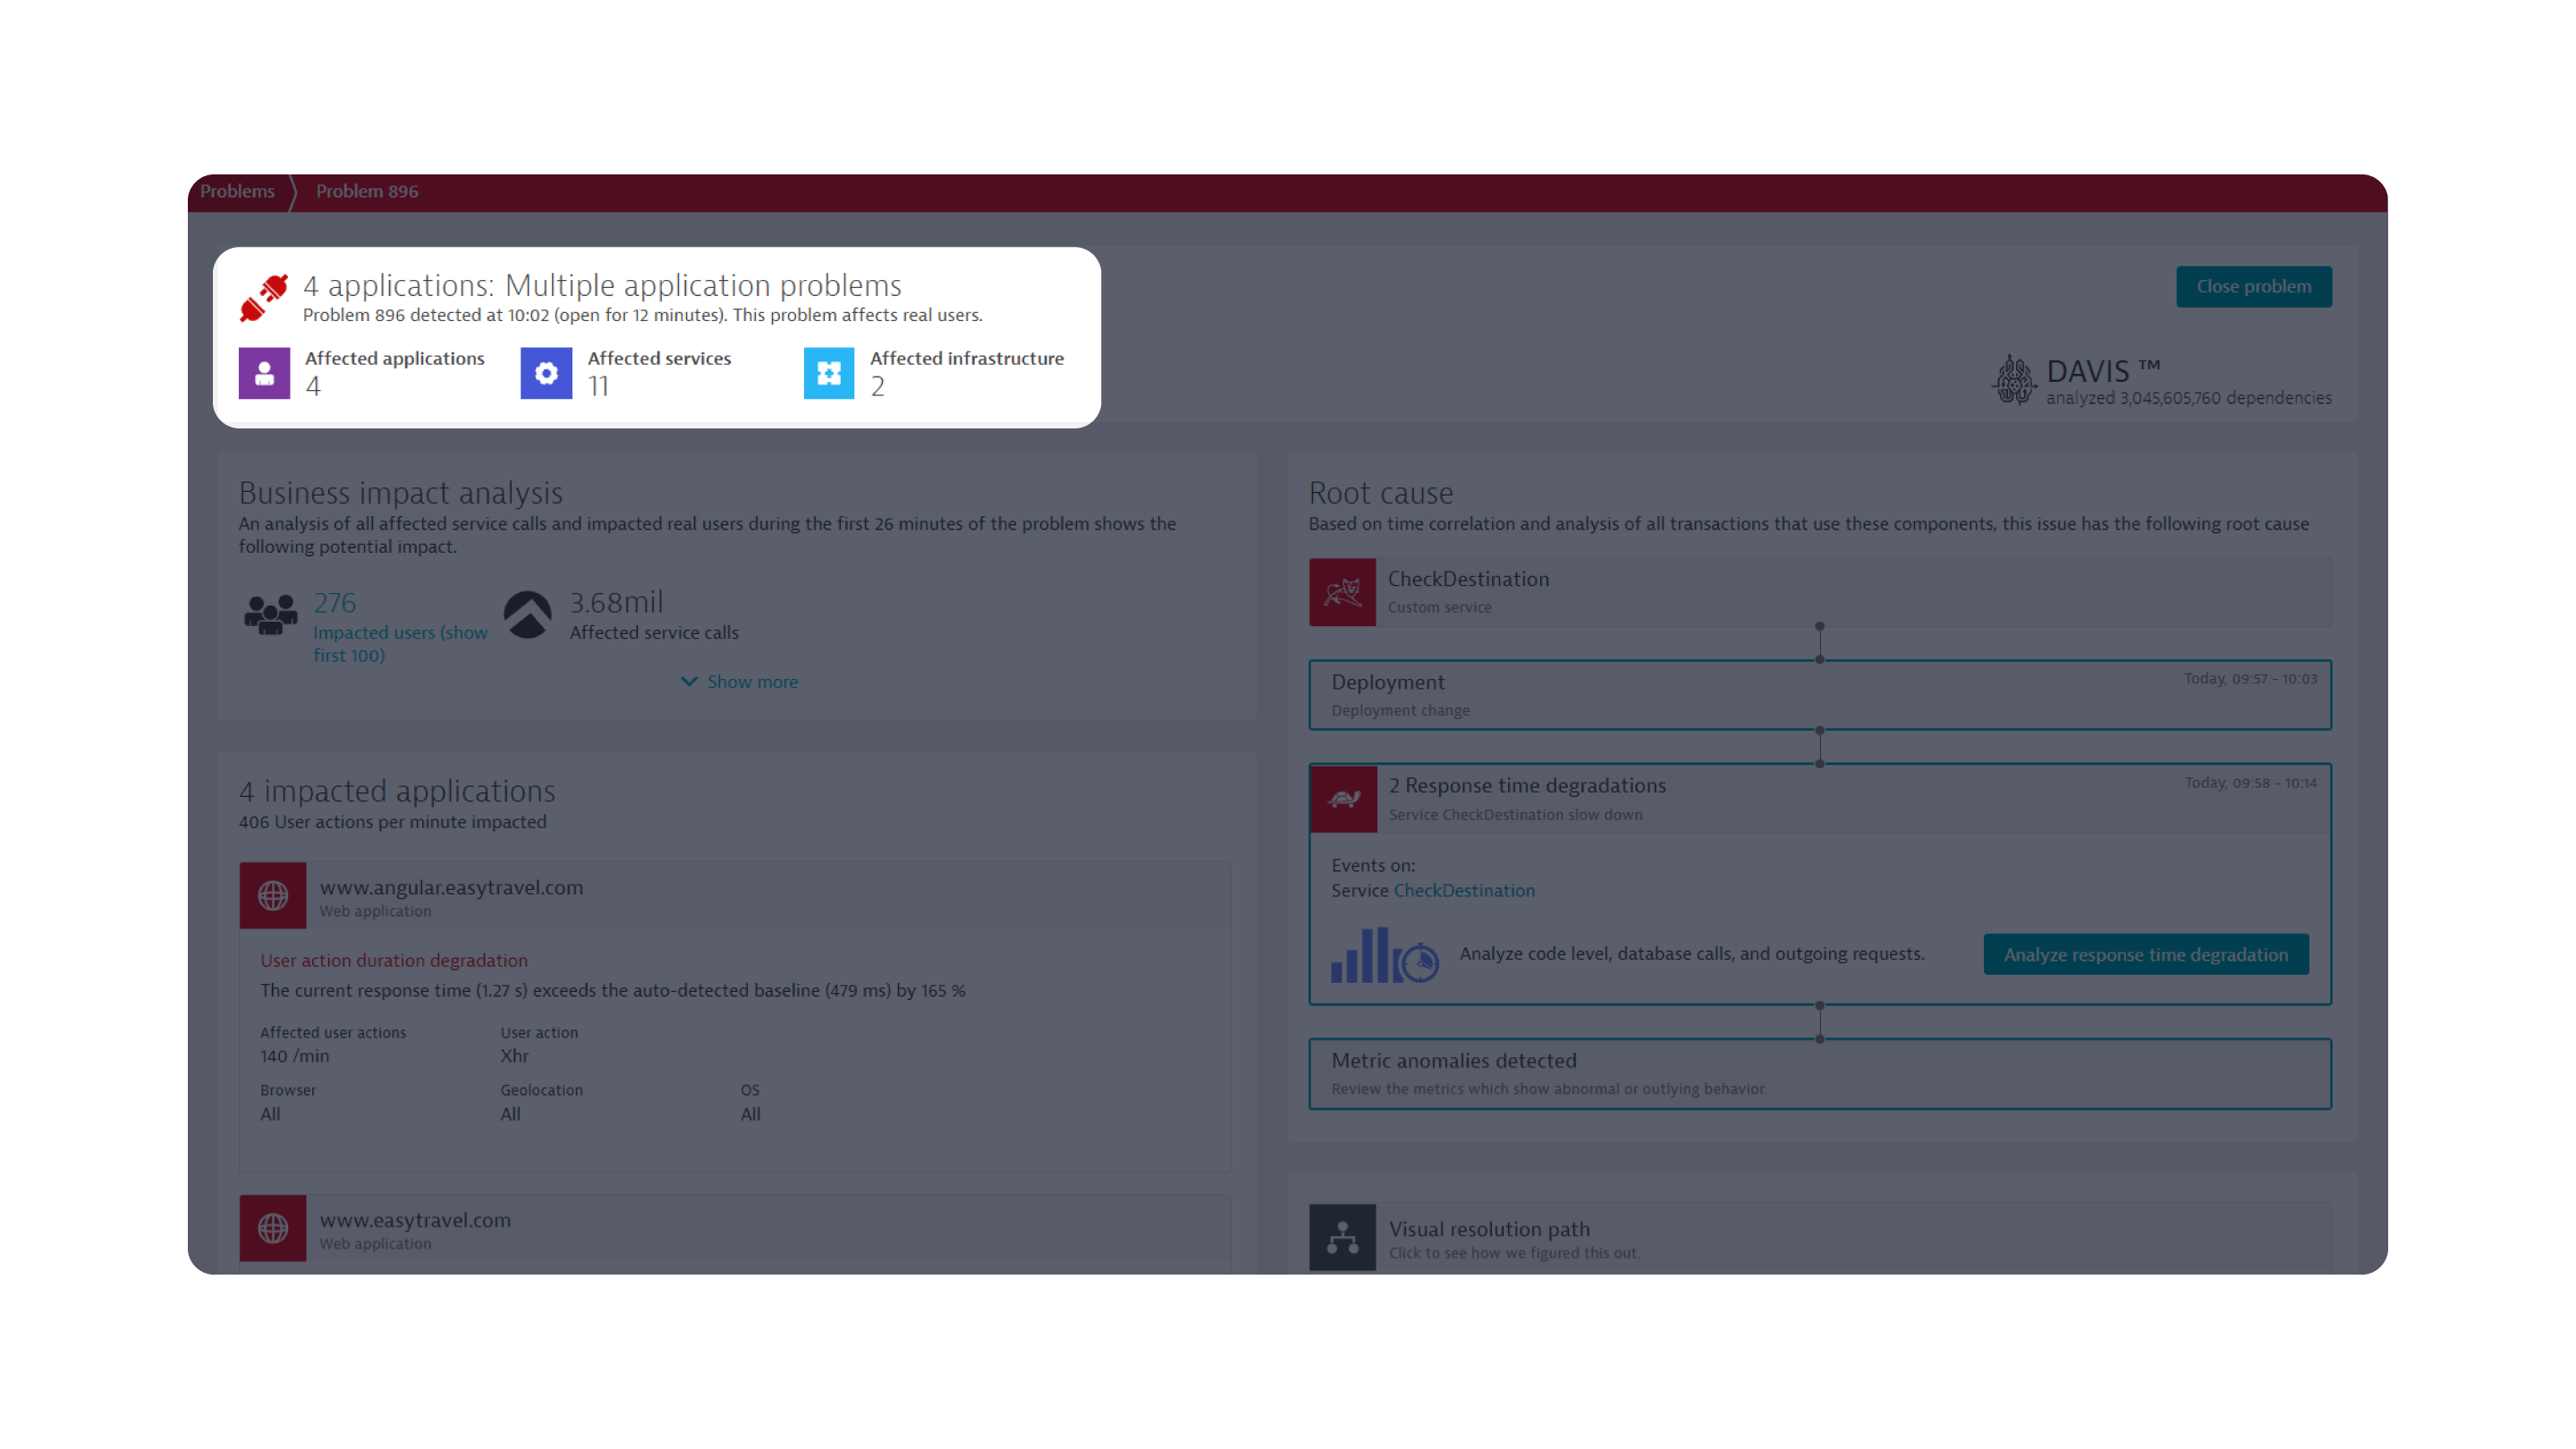
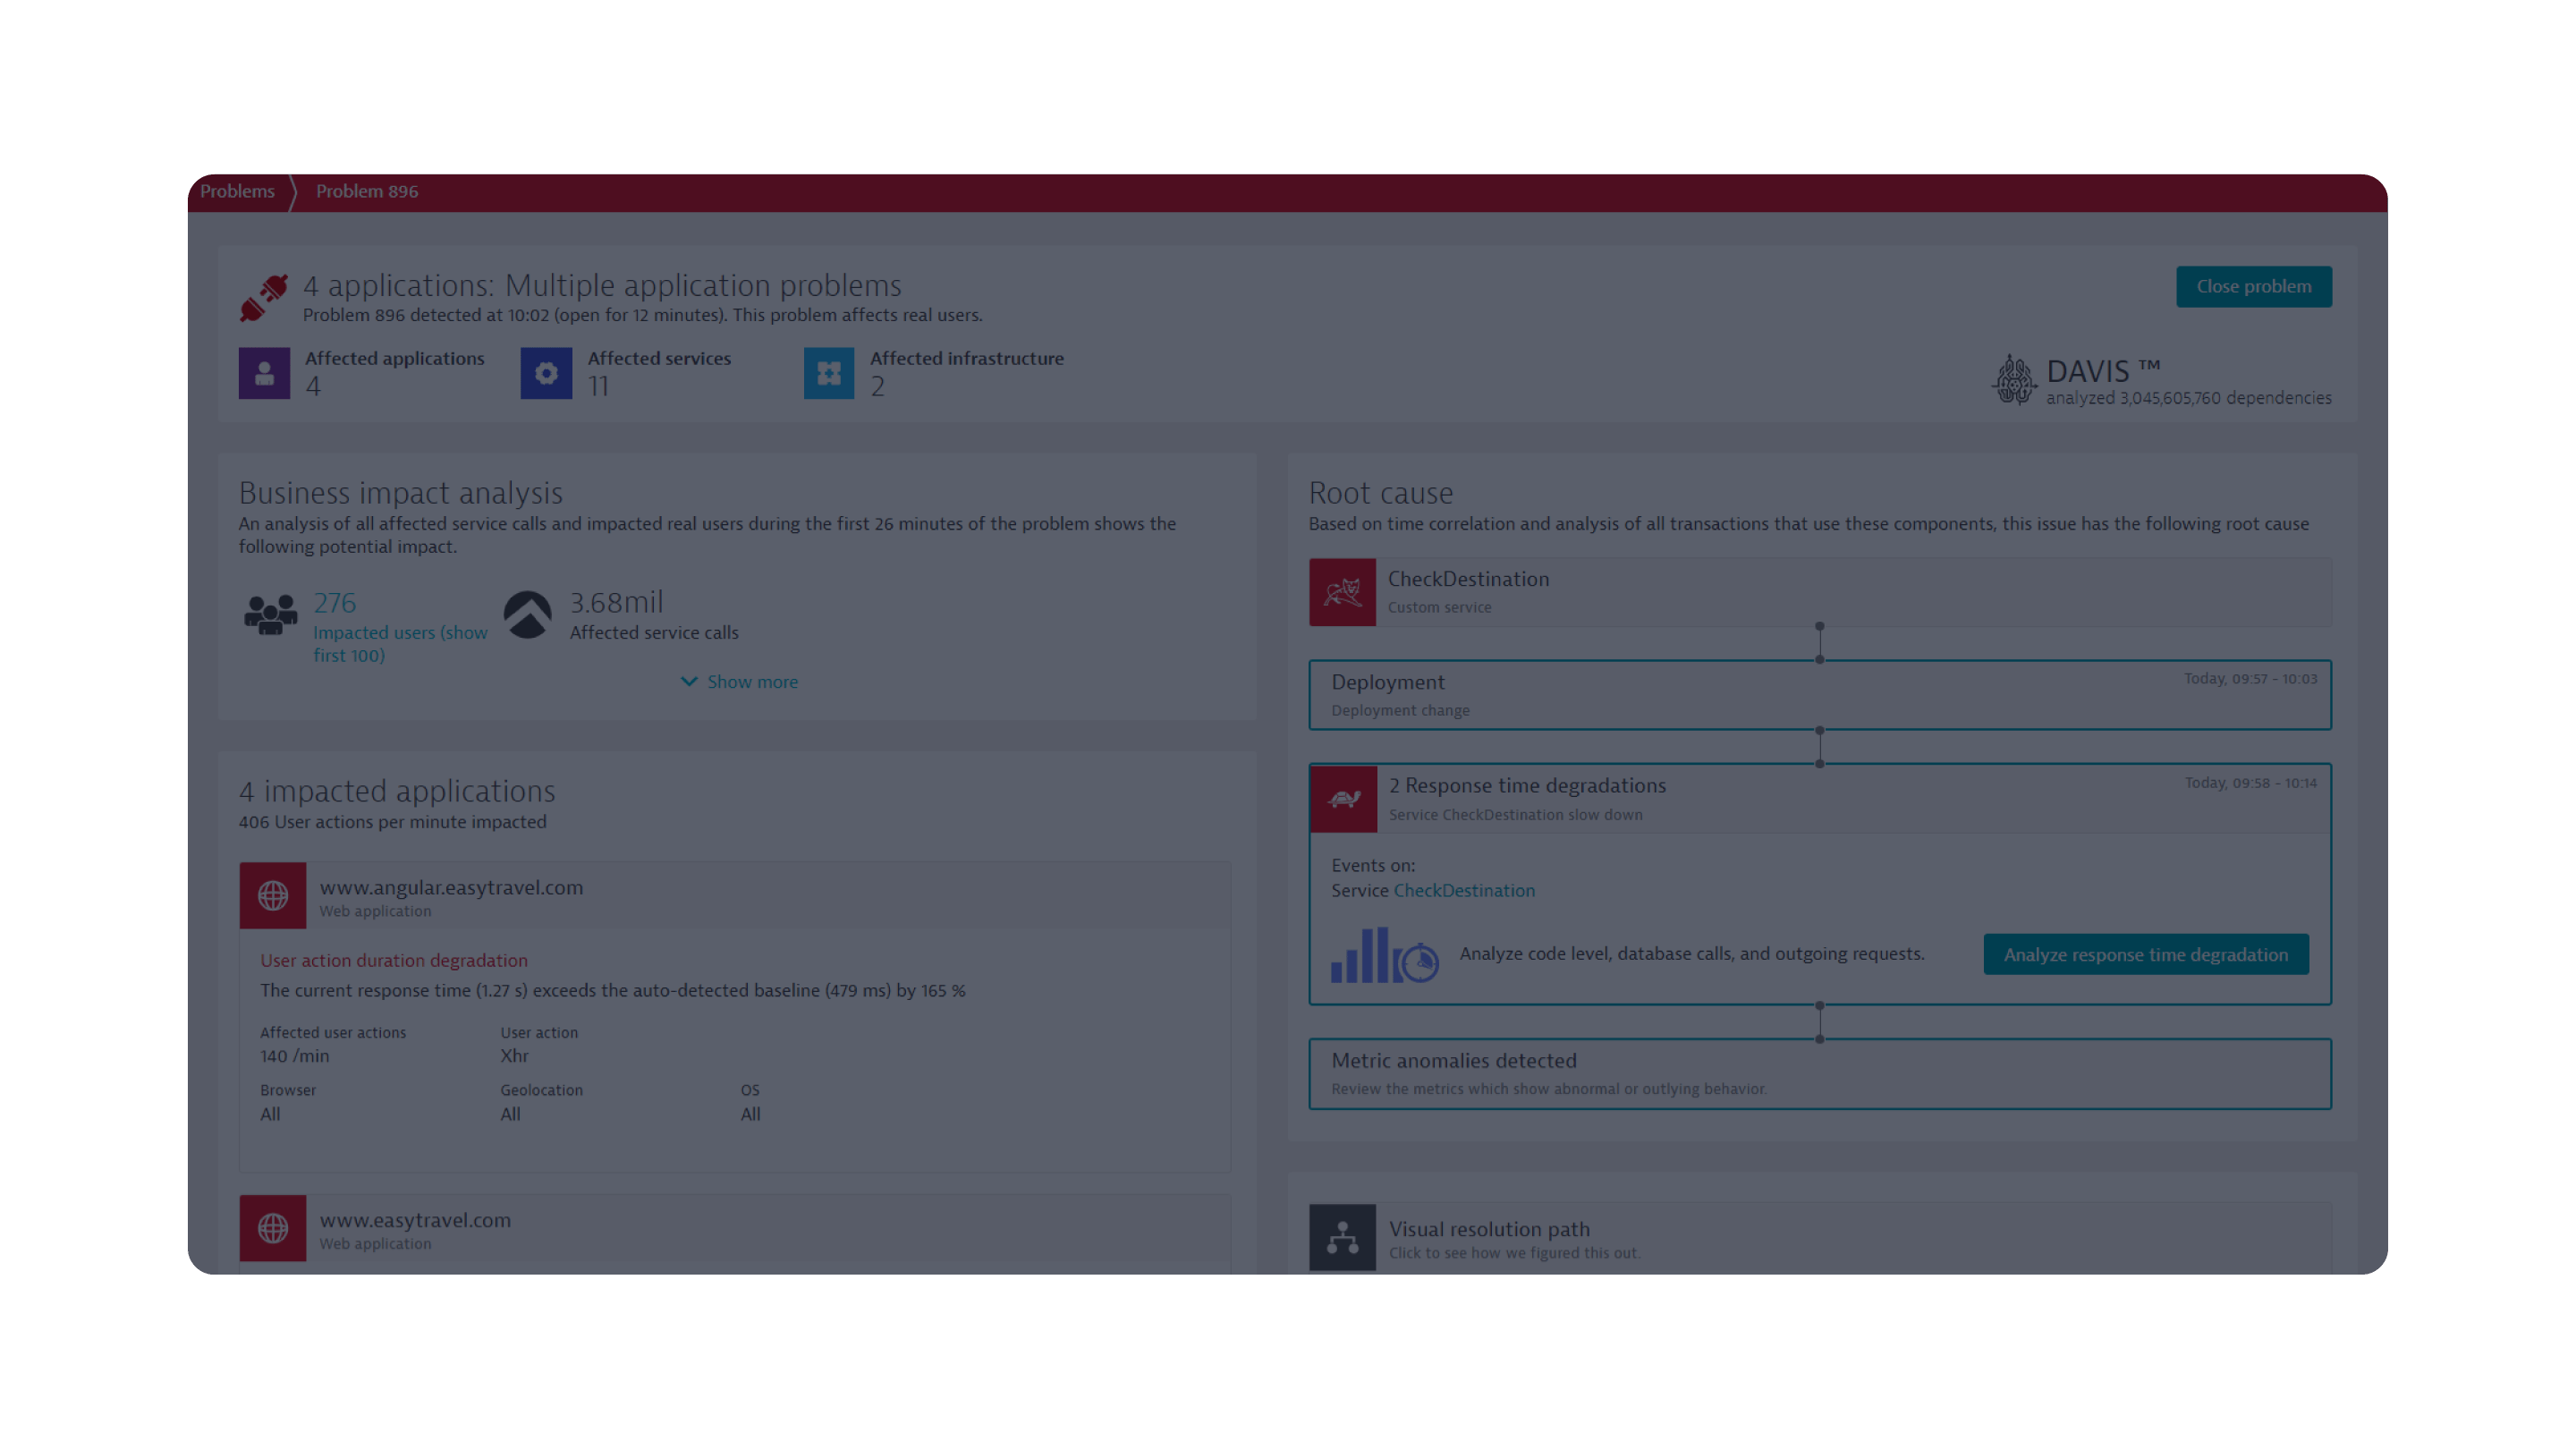
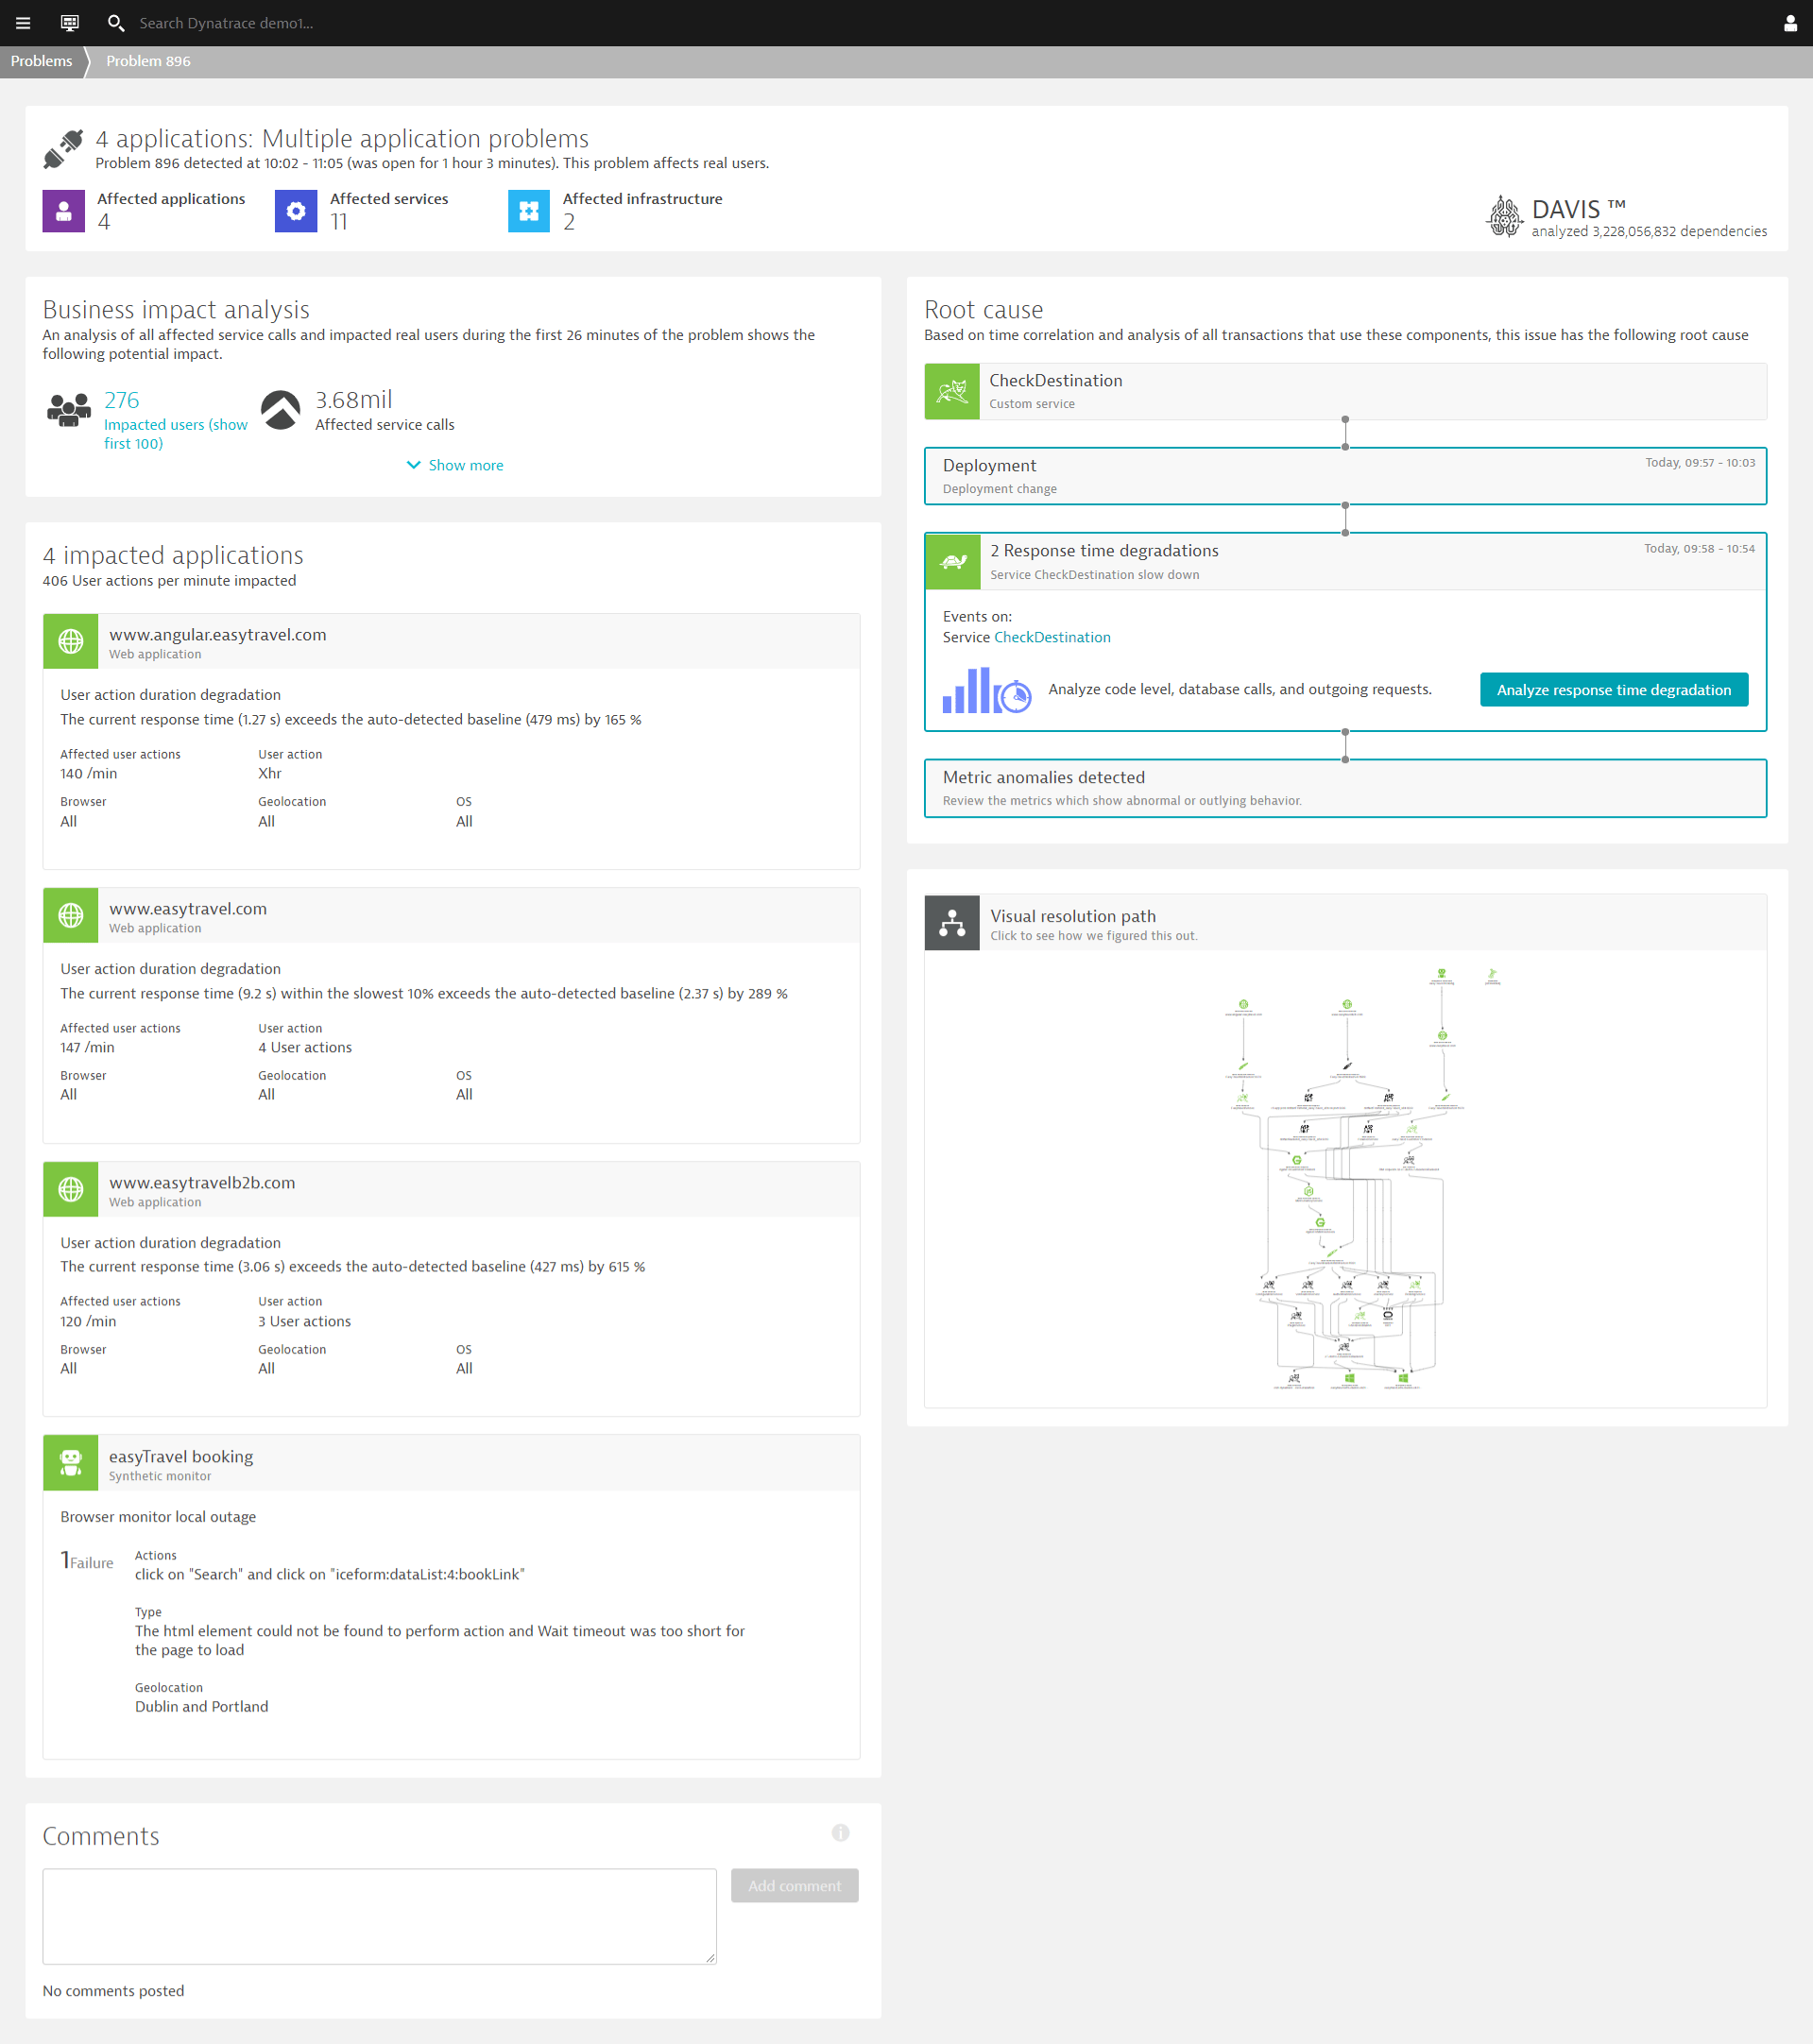
Immediately understand the impact on applications, services, infrastructure, and users.
2/6
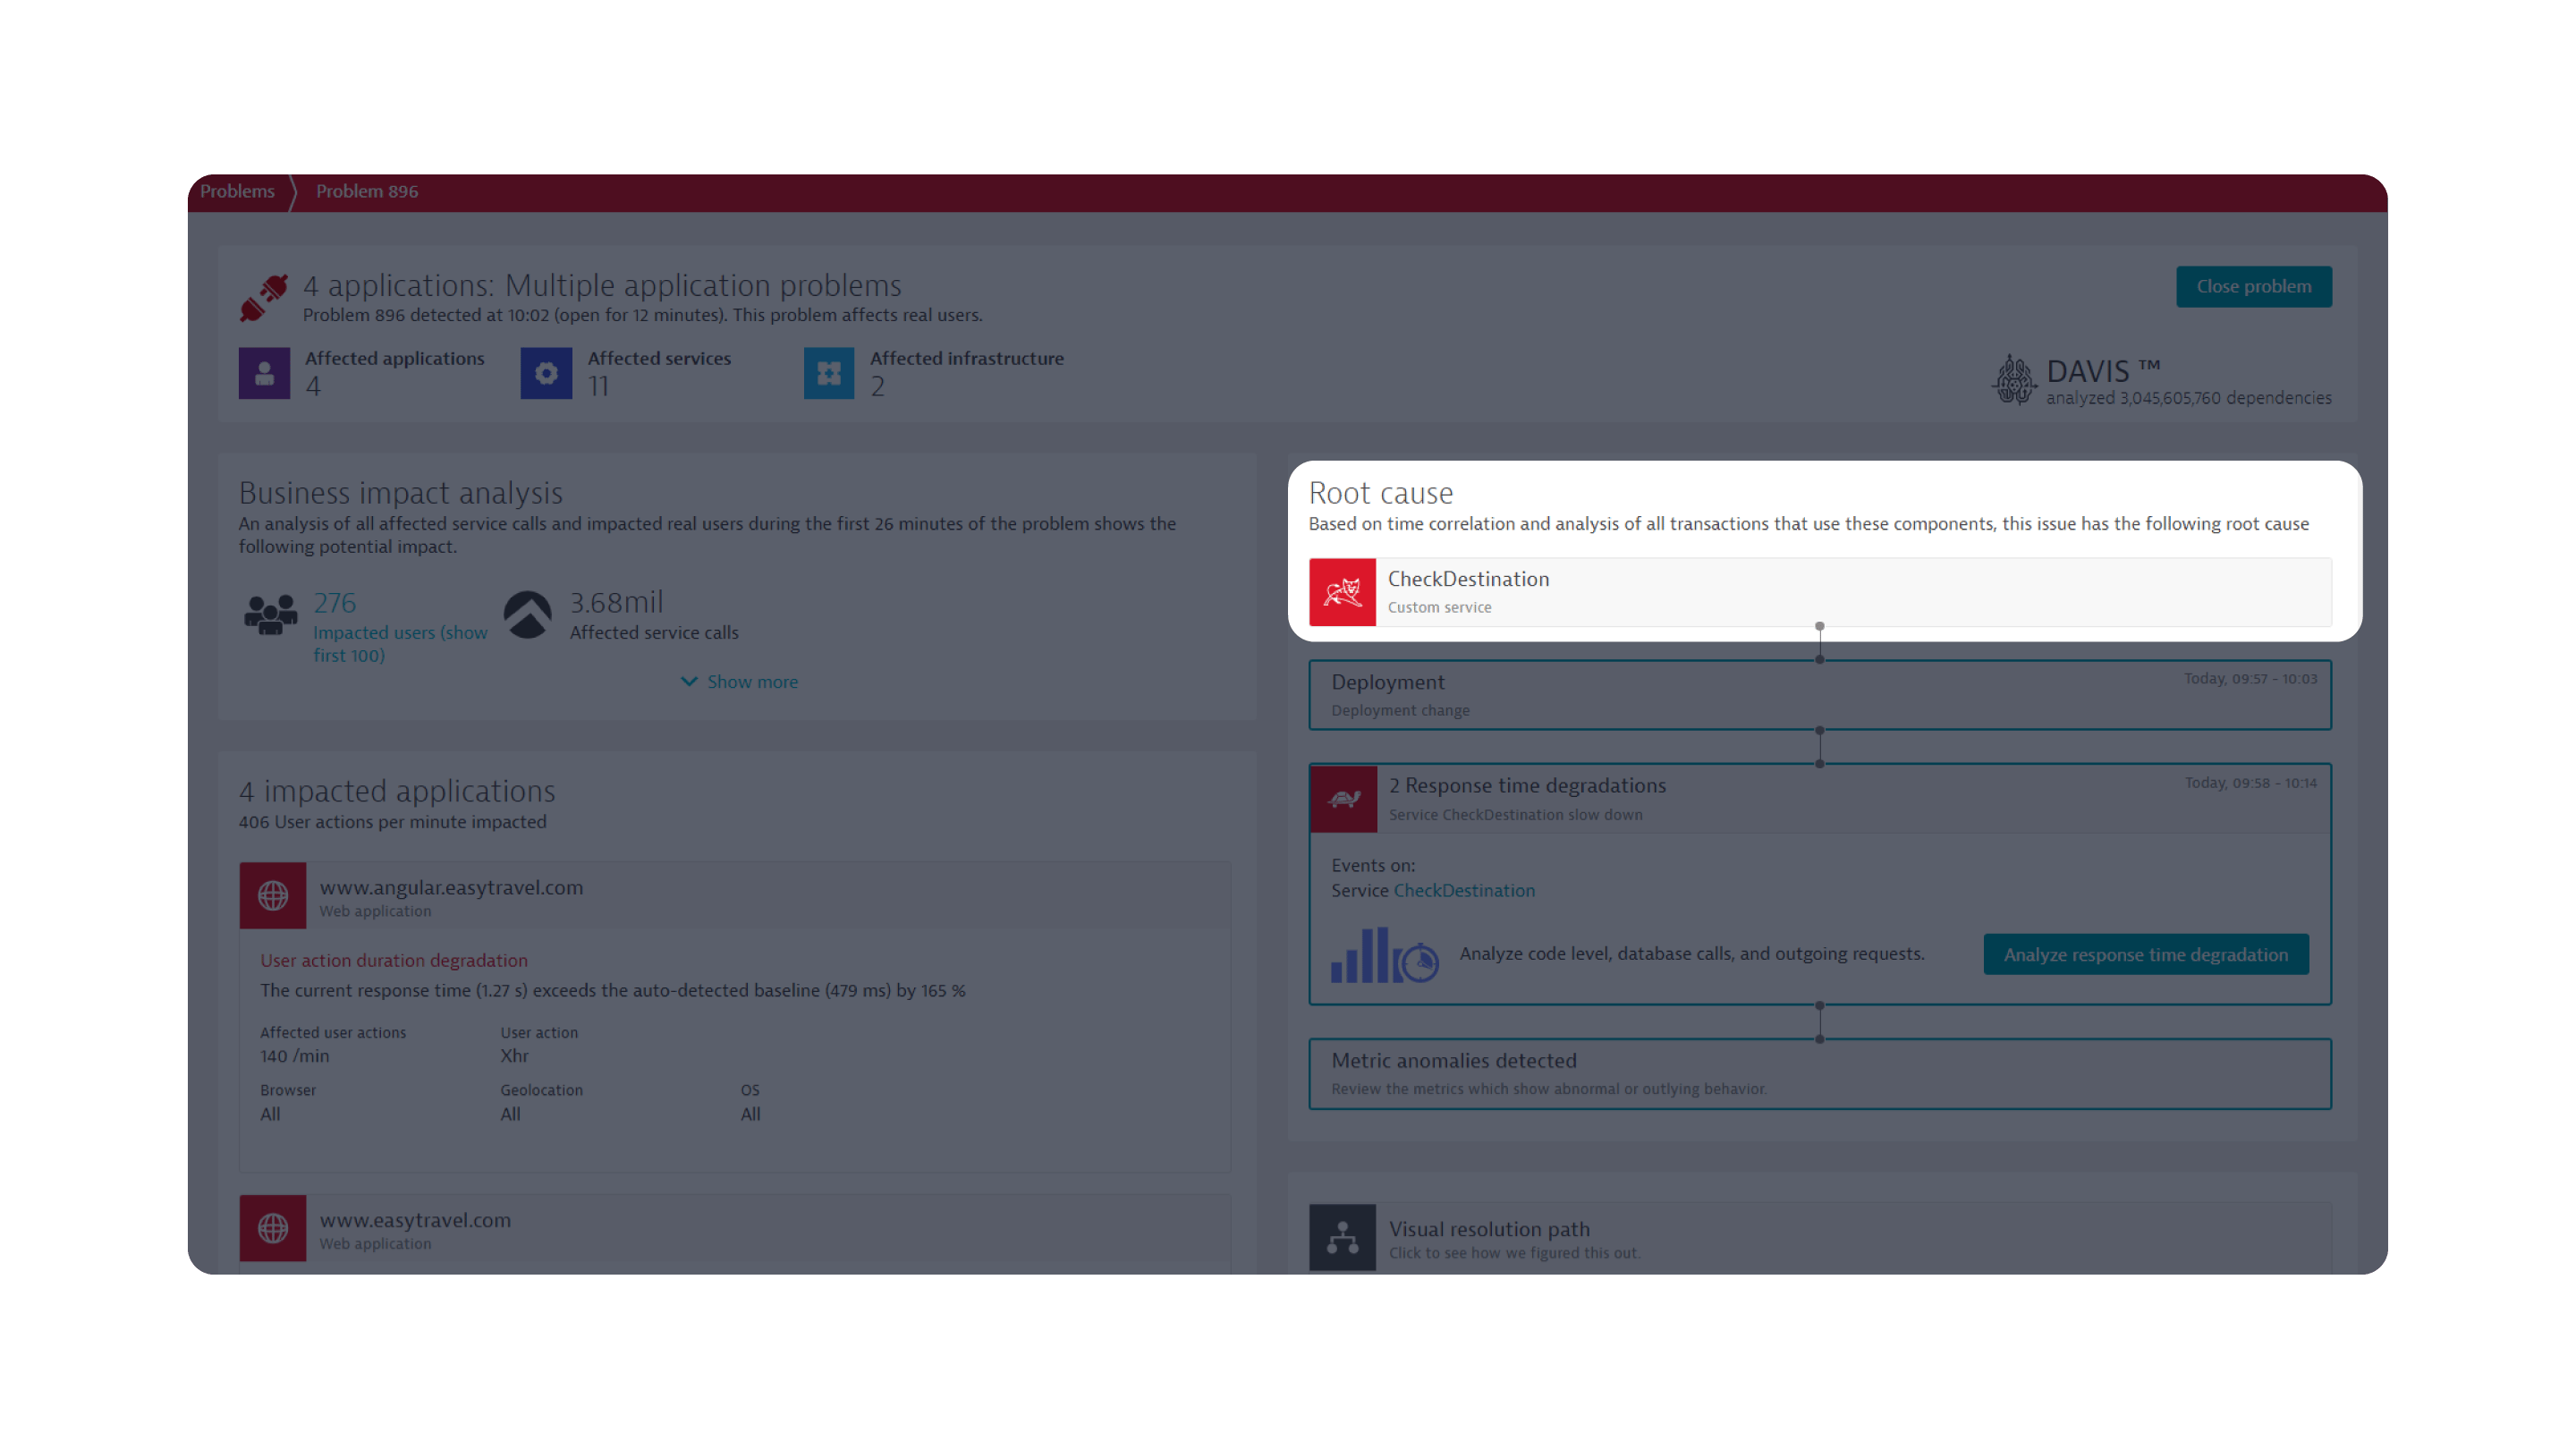
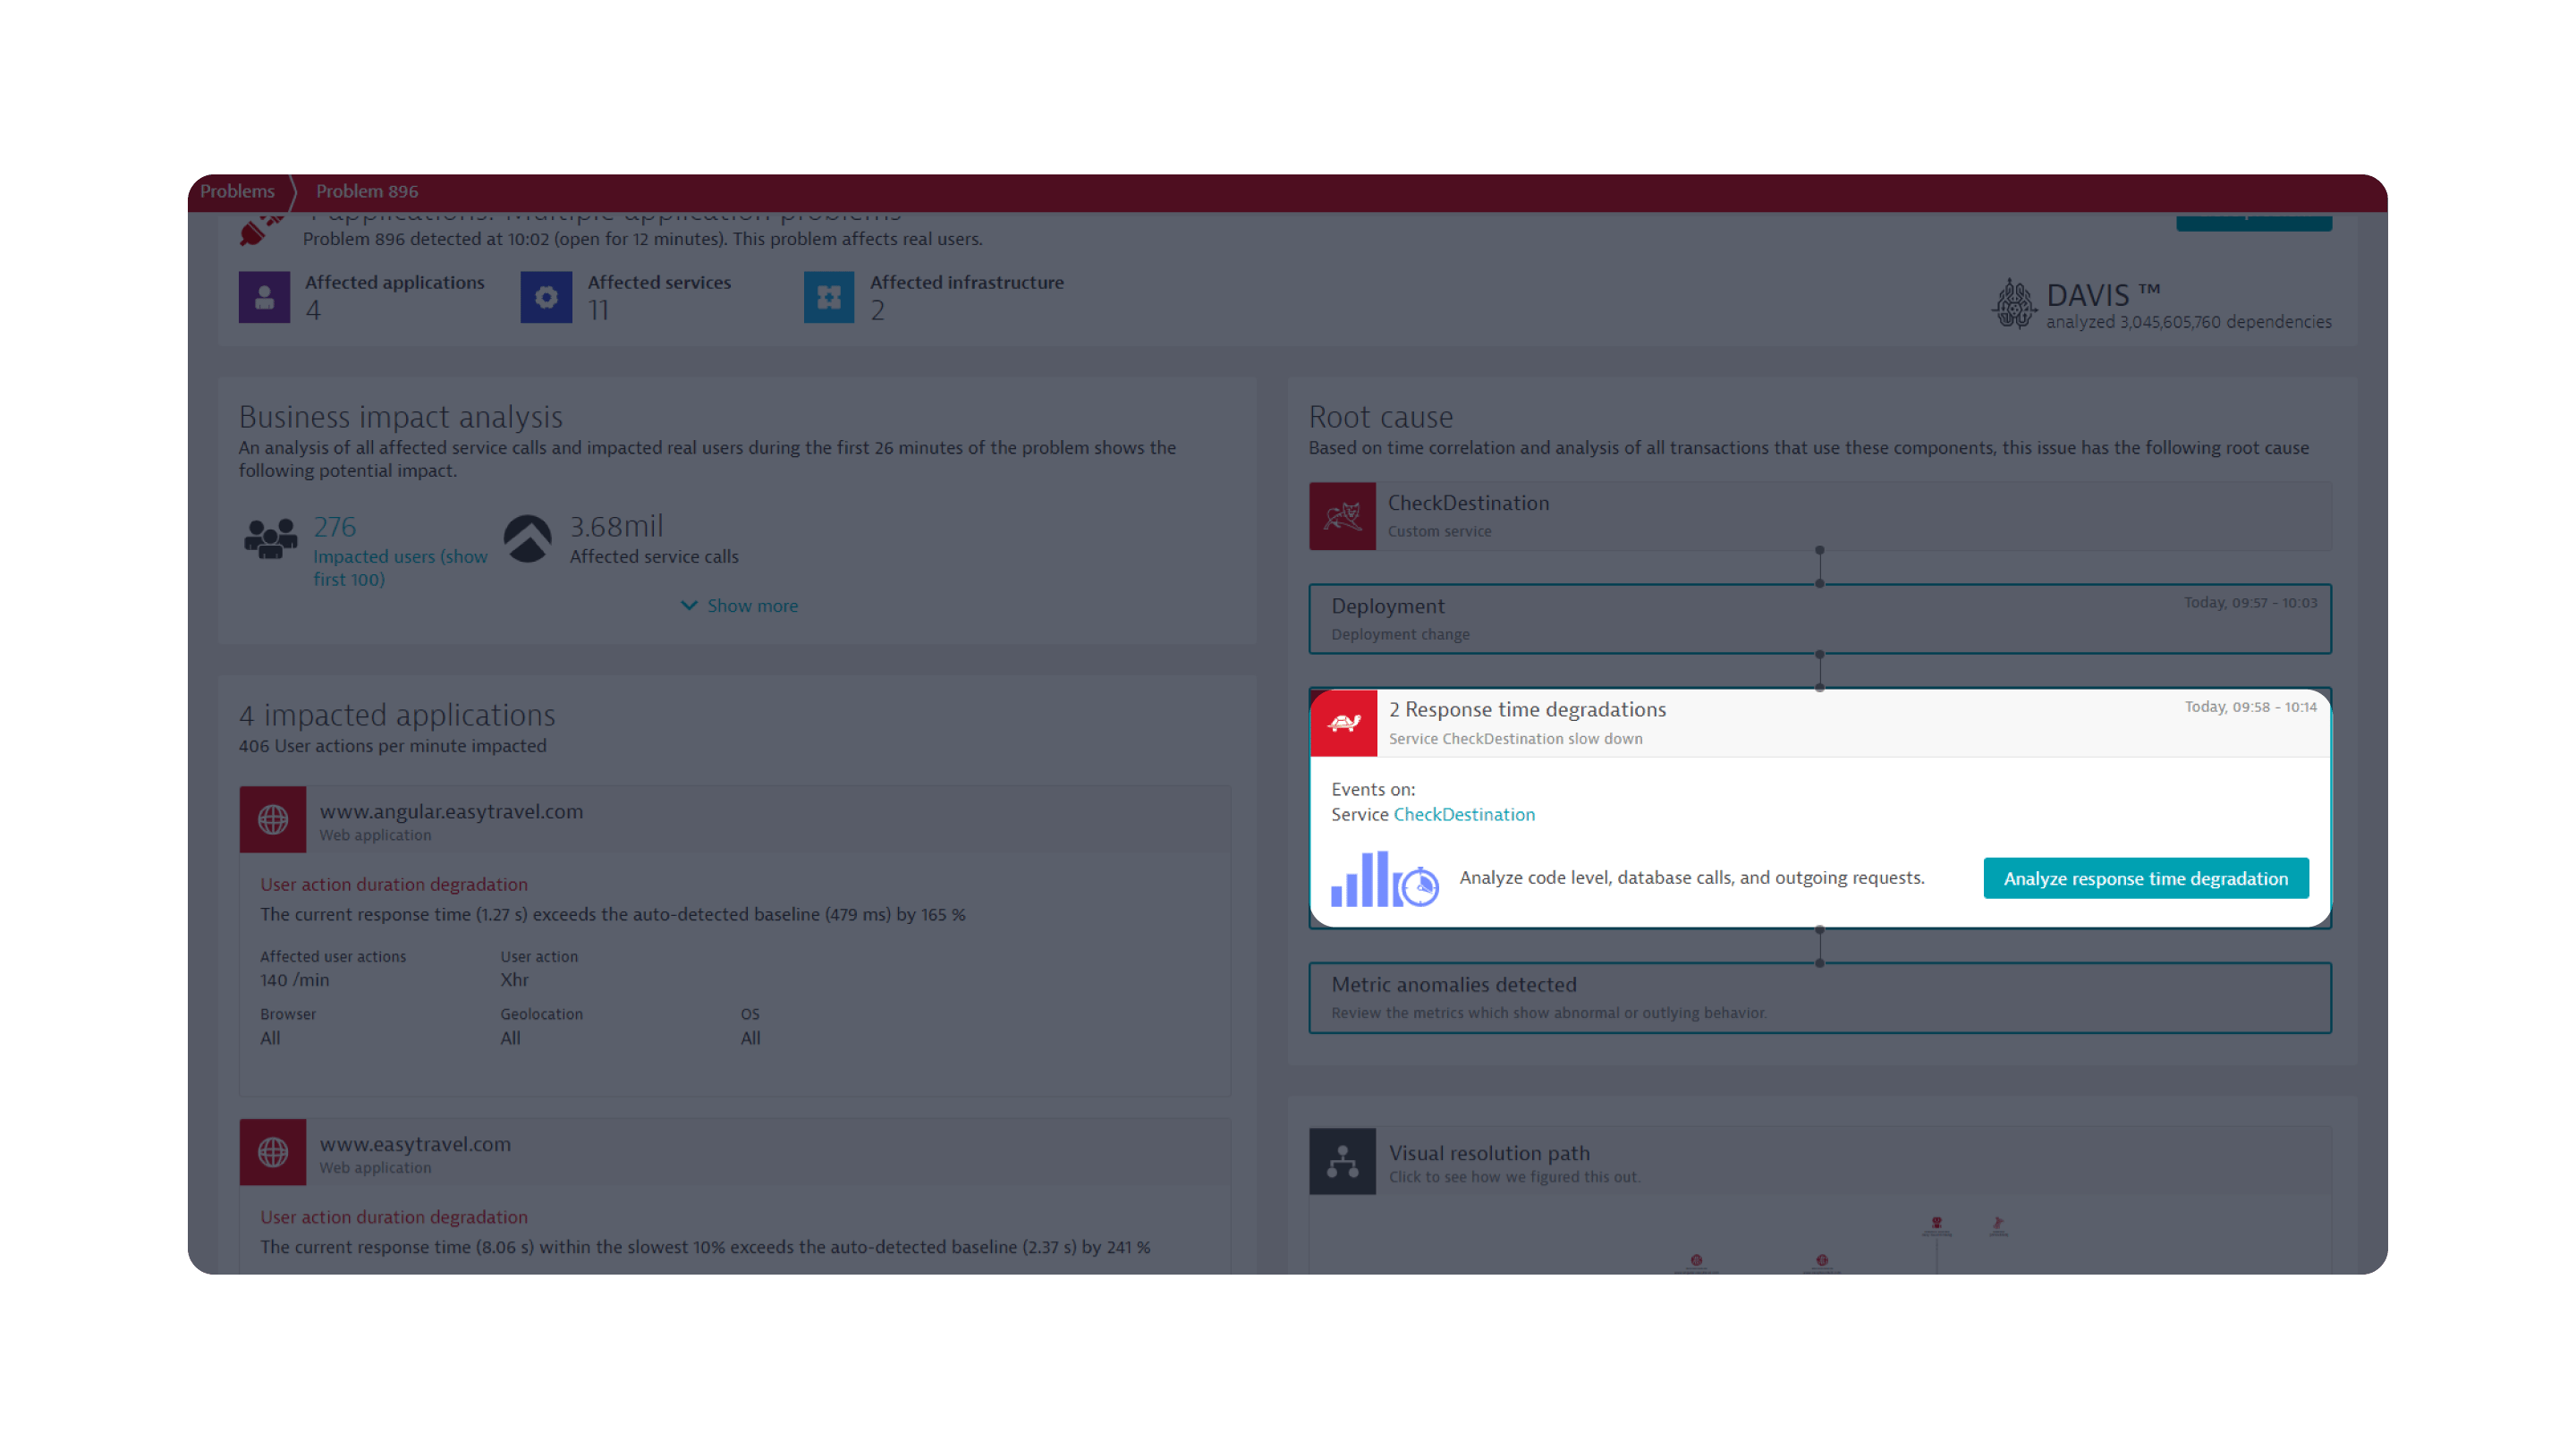
Get instant root cause – in this case, an issue with the CheckDestination service caused by a deployment change – from our AI, Davis.
3/6
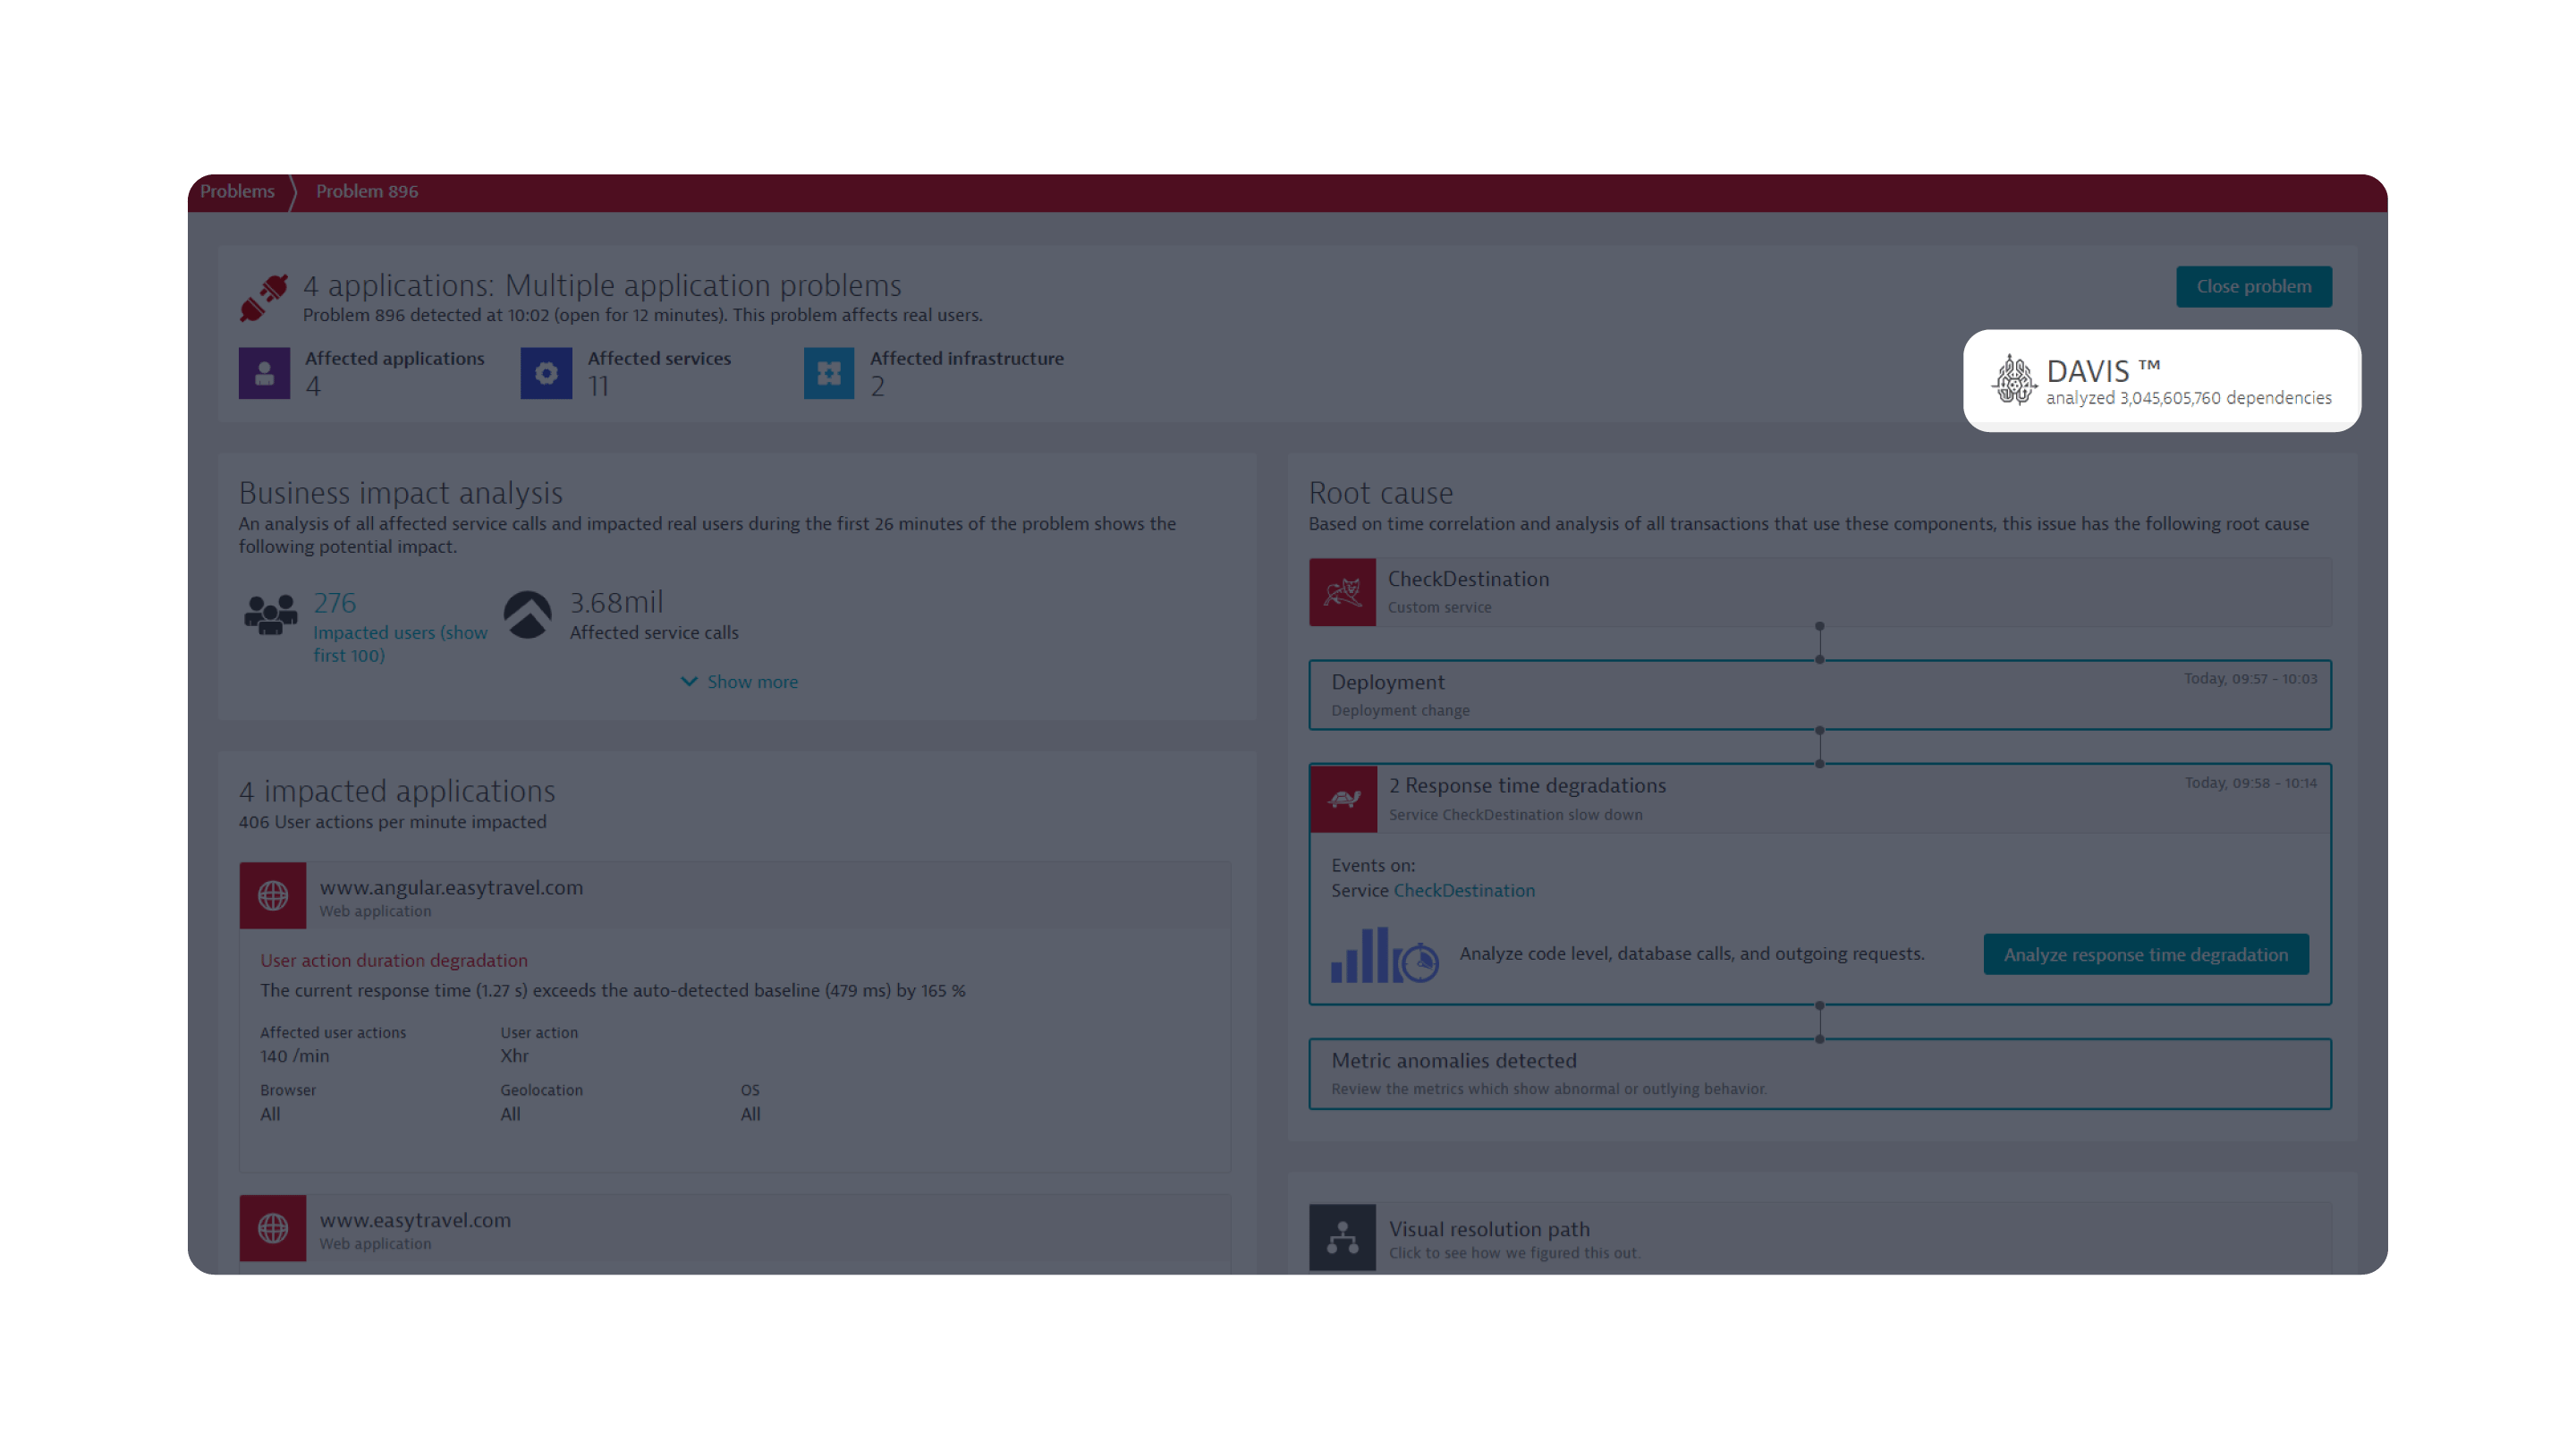
Stop guessing, start knowing. Davis continuously analyzes the billions of dependencies automatically mapped by Smartscape to deliver precise answers in real time.
4/6
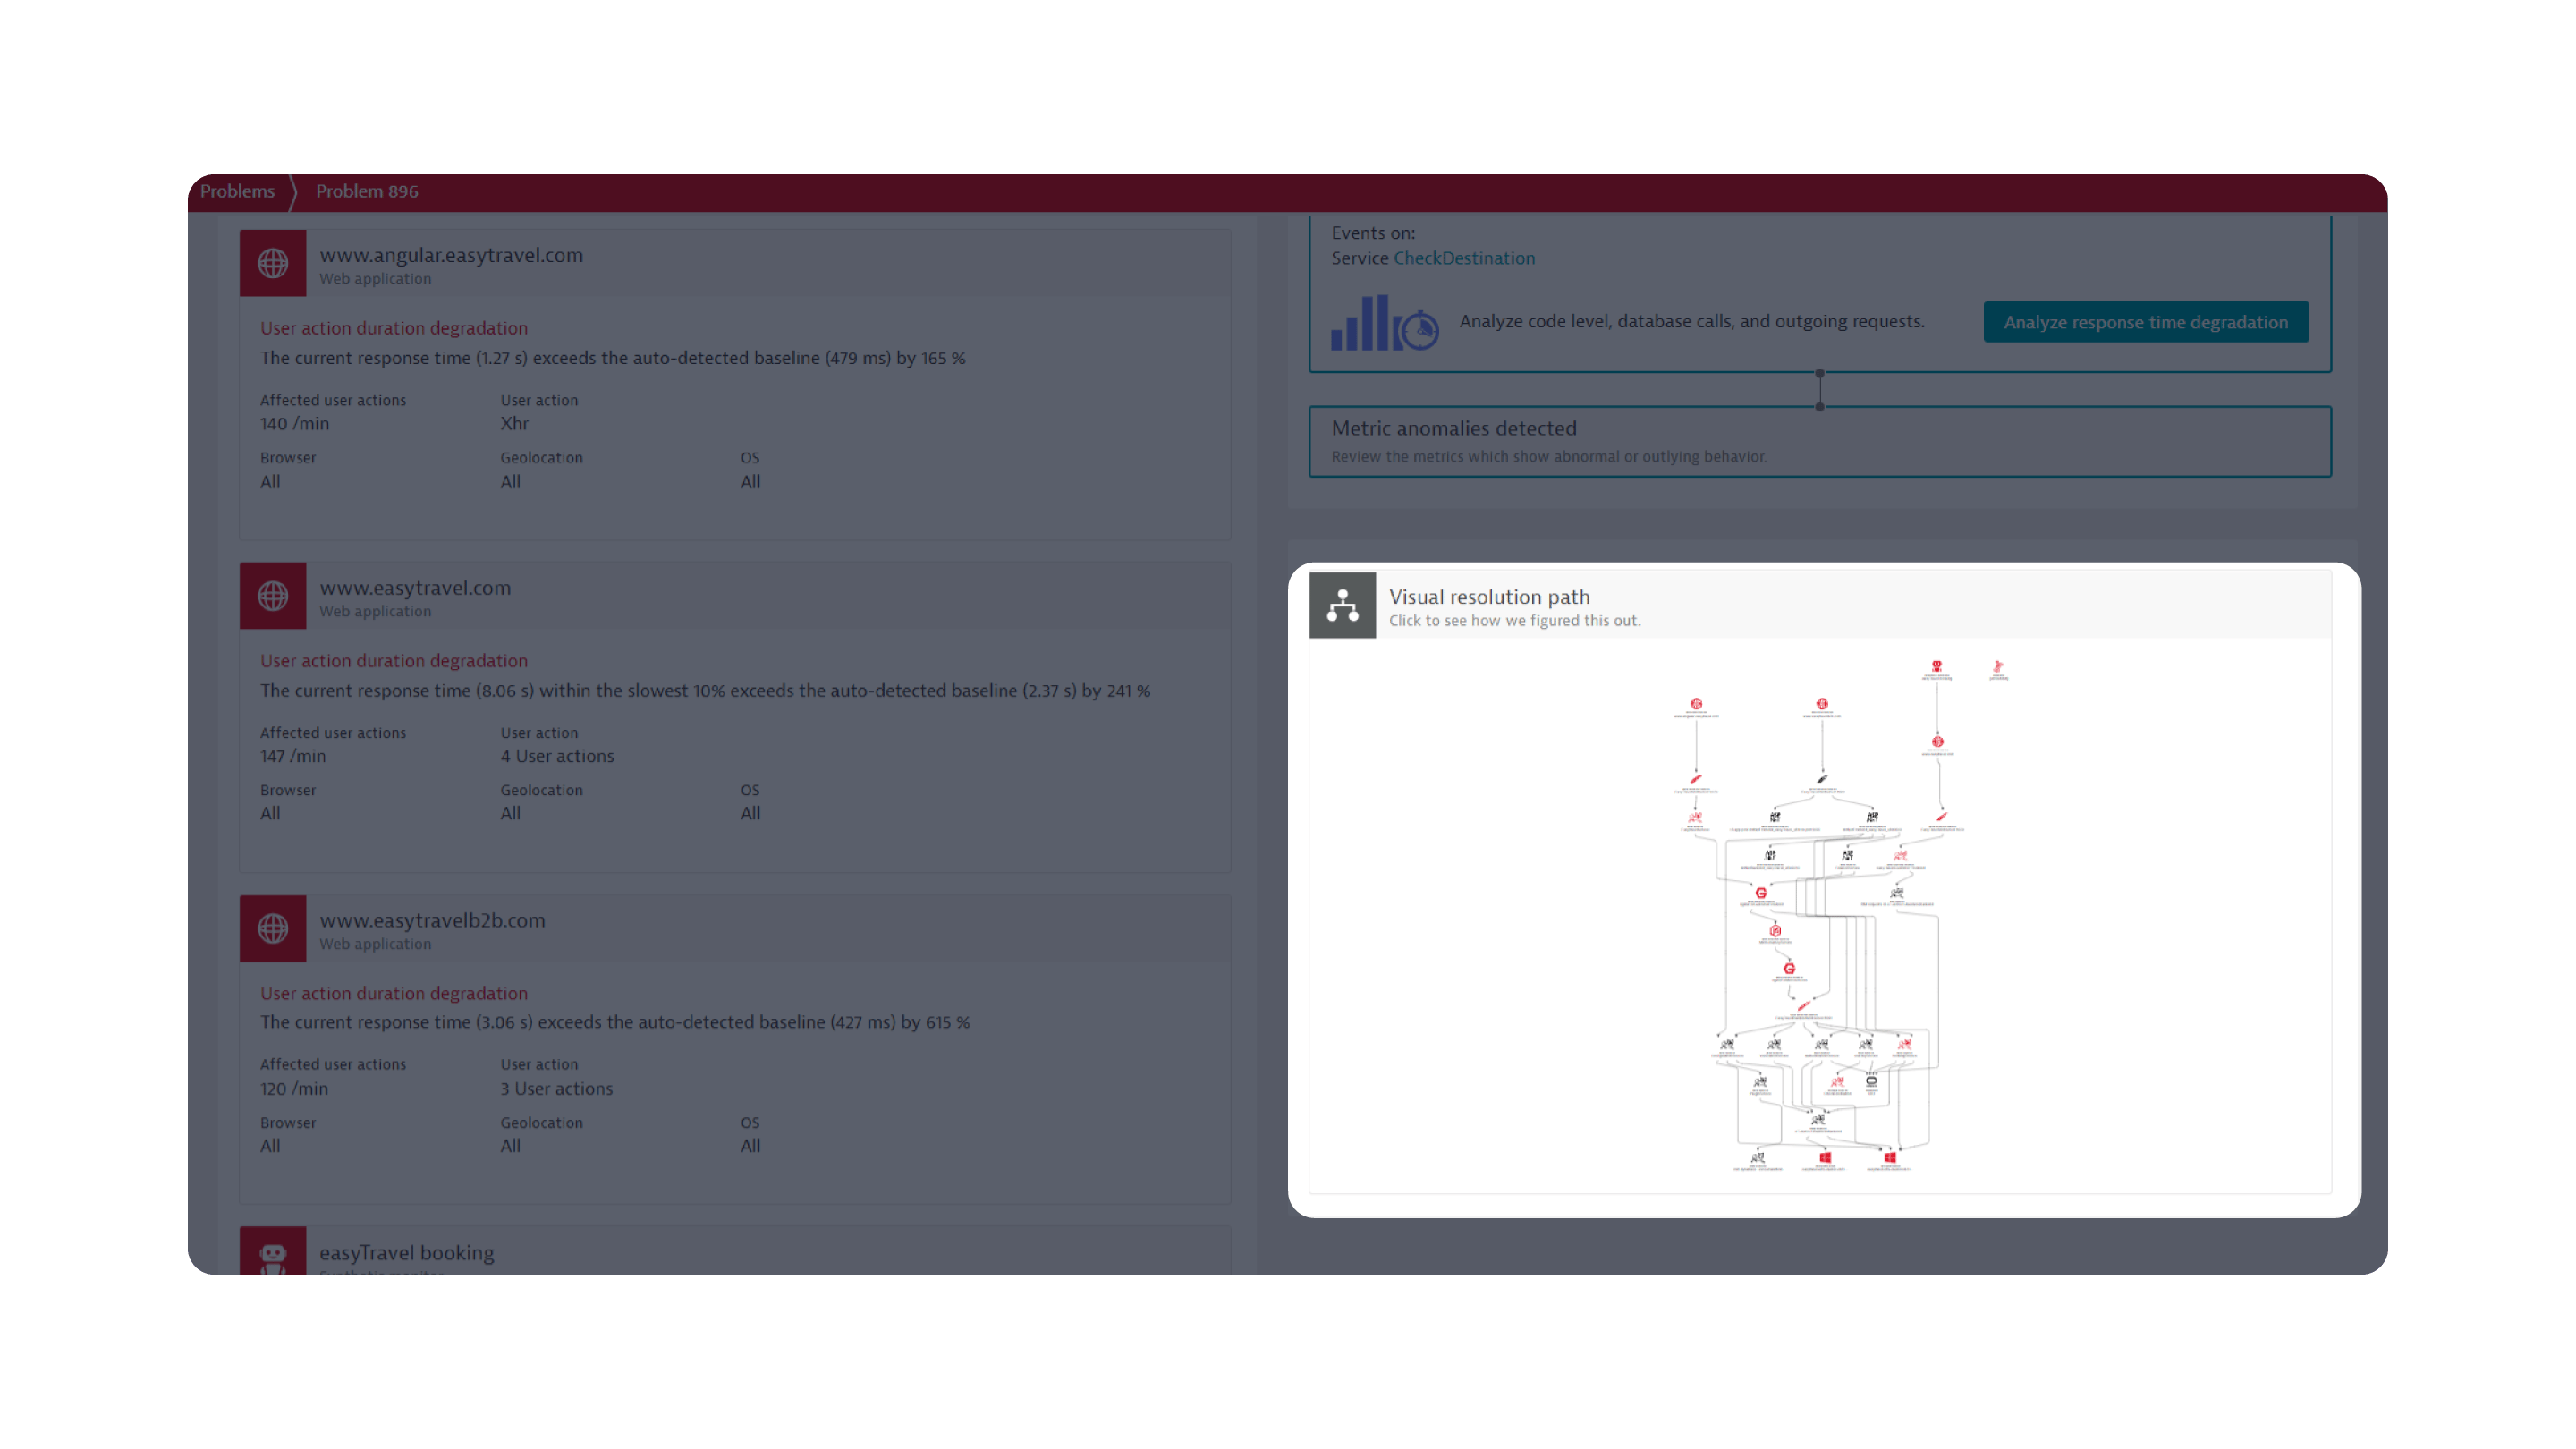
Pinpoint the portion of your environment affected – from applications to infrastructure on a visual resolution path.
5/6
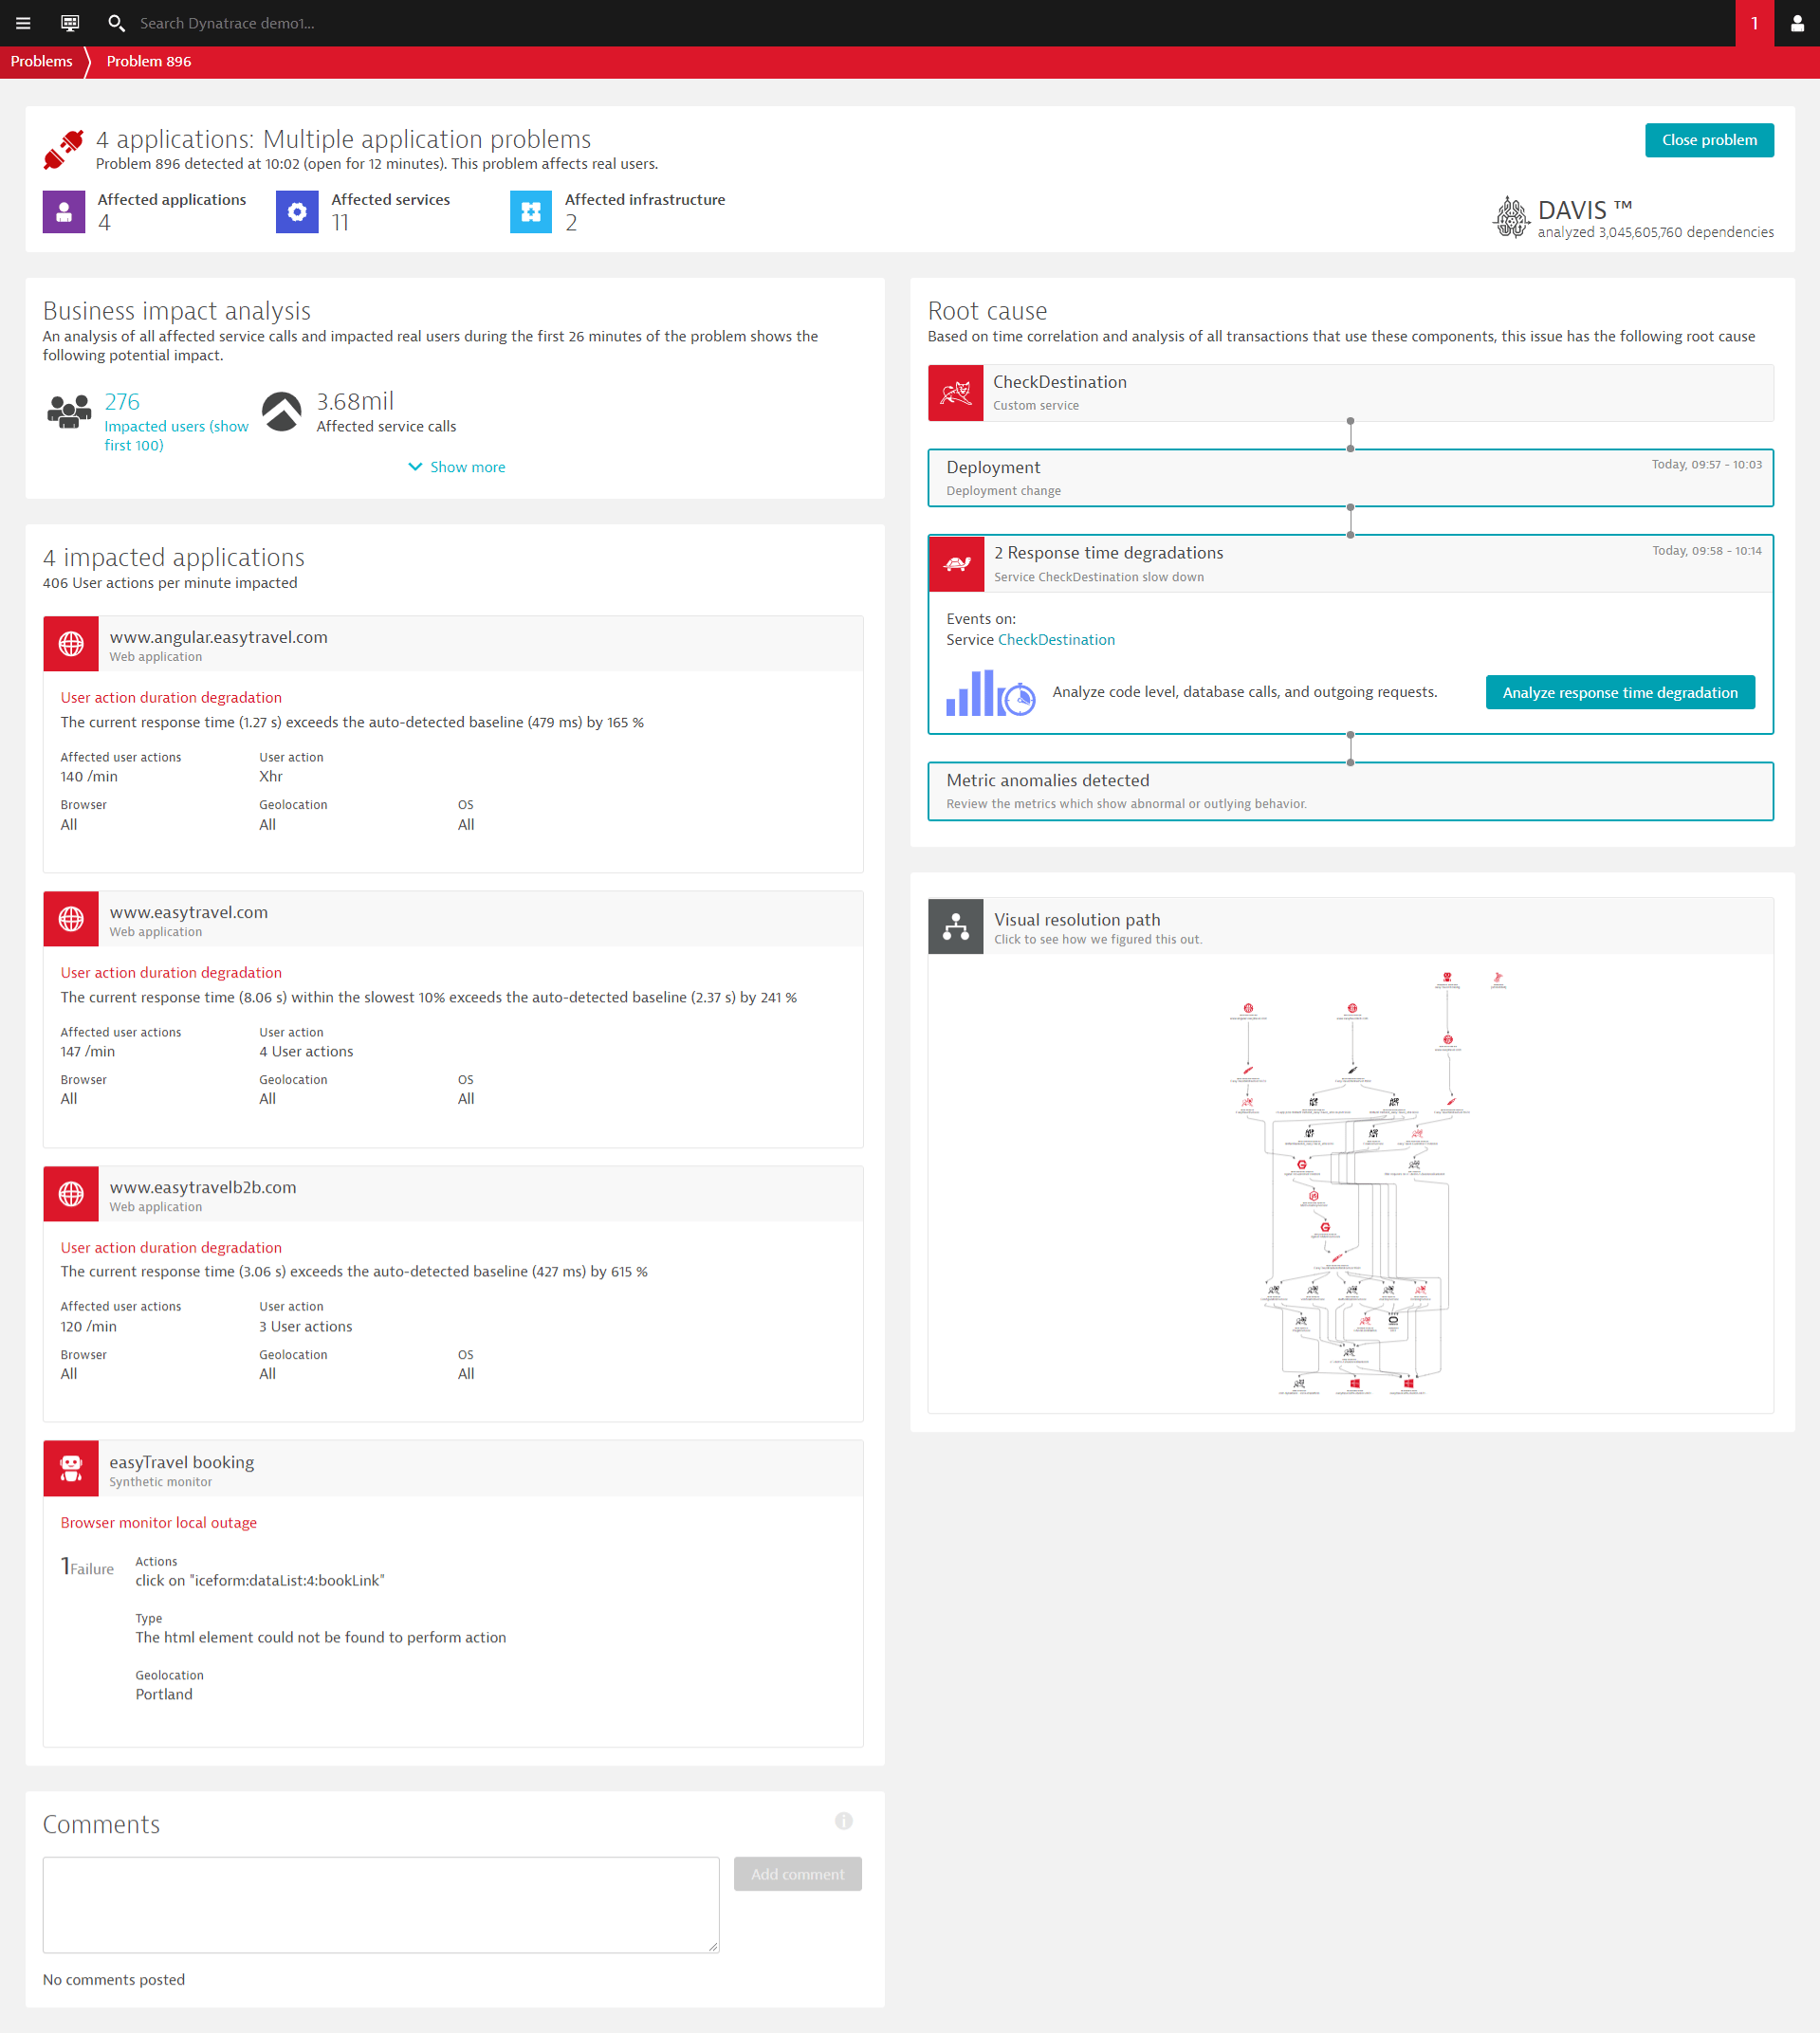
Davis provides continuous, automatic analysis of issues. Click next to continue and analyze response time degradation.
6/6
APPLICATIONS & MICROSERVICES
Free trial
Request demo
Show me
Explore a sample problem to see how Dynatrace helps you stay on top of modern, dynamic cloud environments, automatically suppress alert noise, and pinpoint precise root cause. Here, Davis AI analyzes billions of dependencies to identify the root cause of an issue in the CheckDestination service, so teams no longer have to invest time and effort on finding problems and instead can pro-actively address issues faster and free time for innovation.
See how we're different
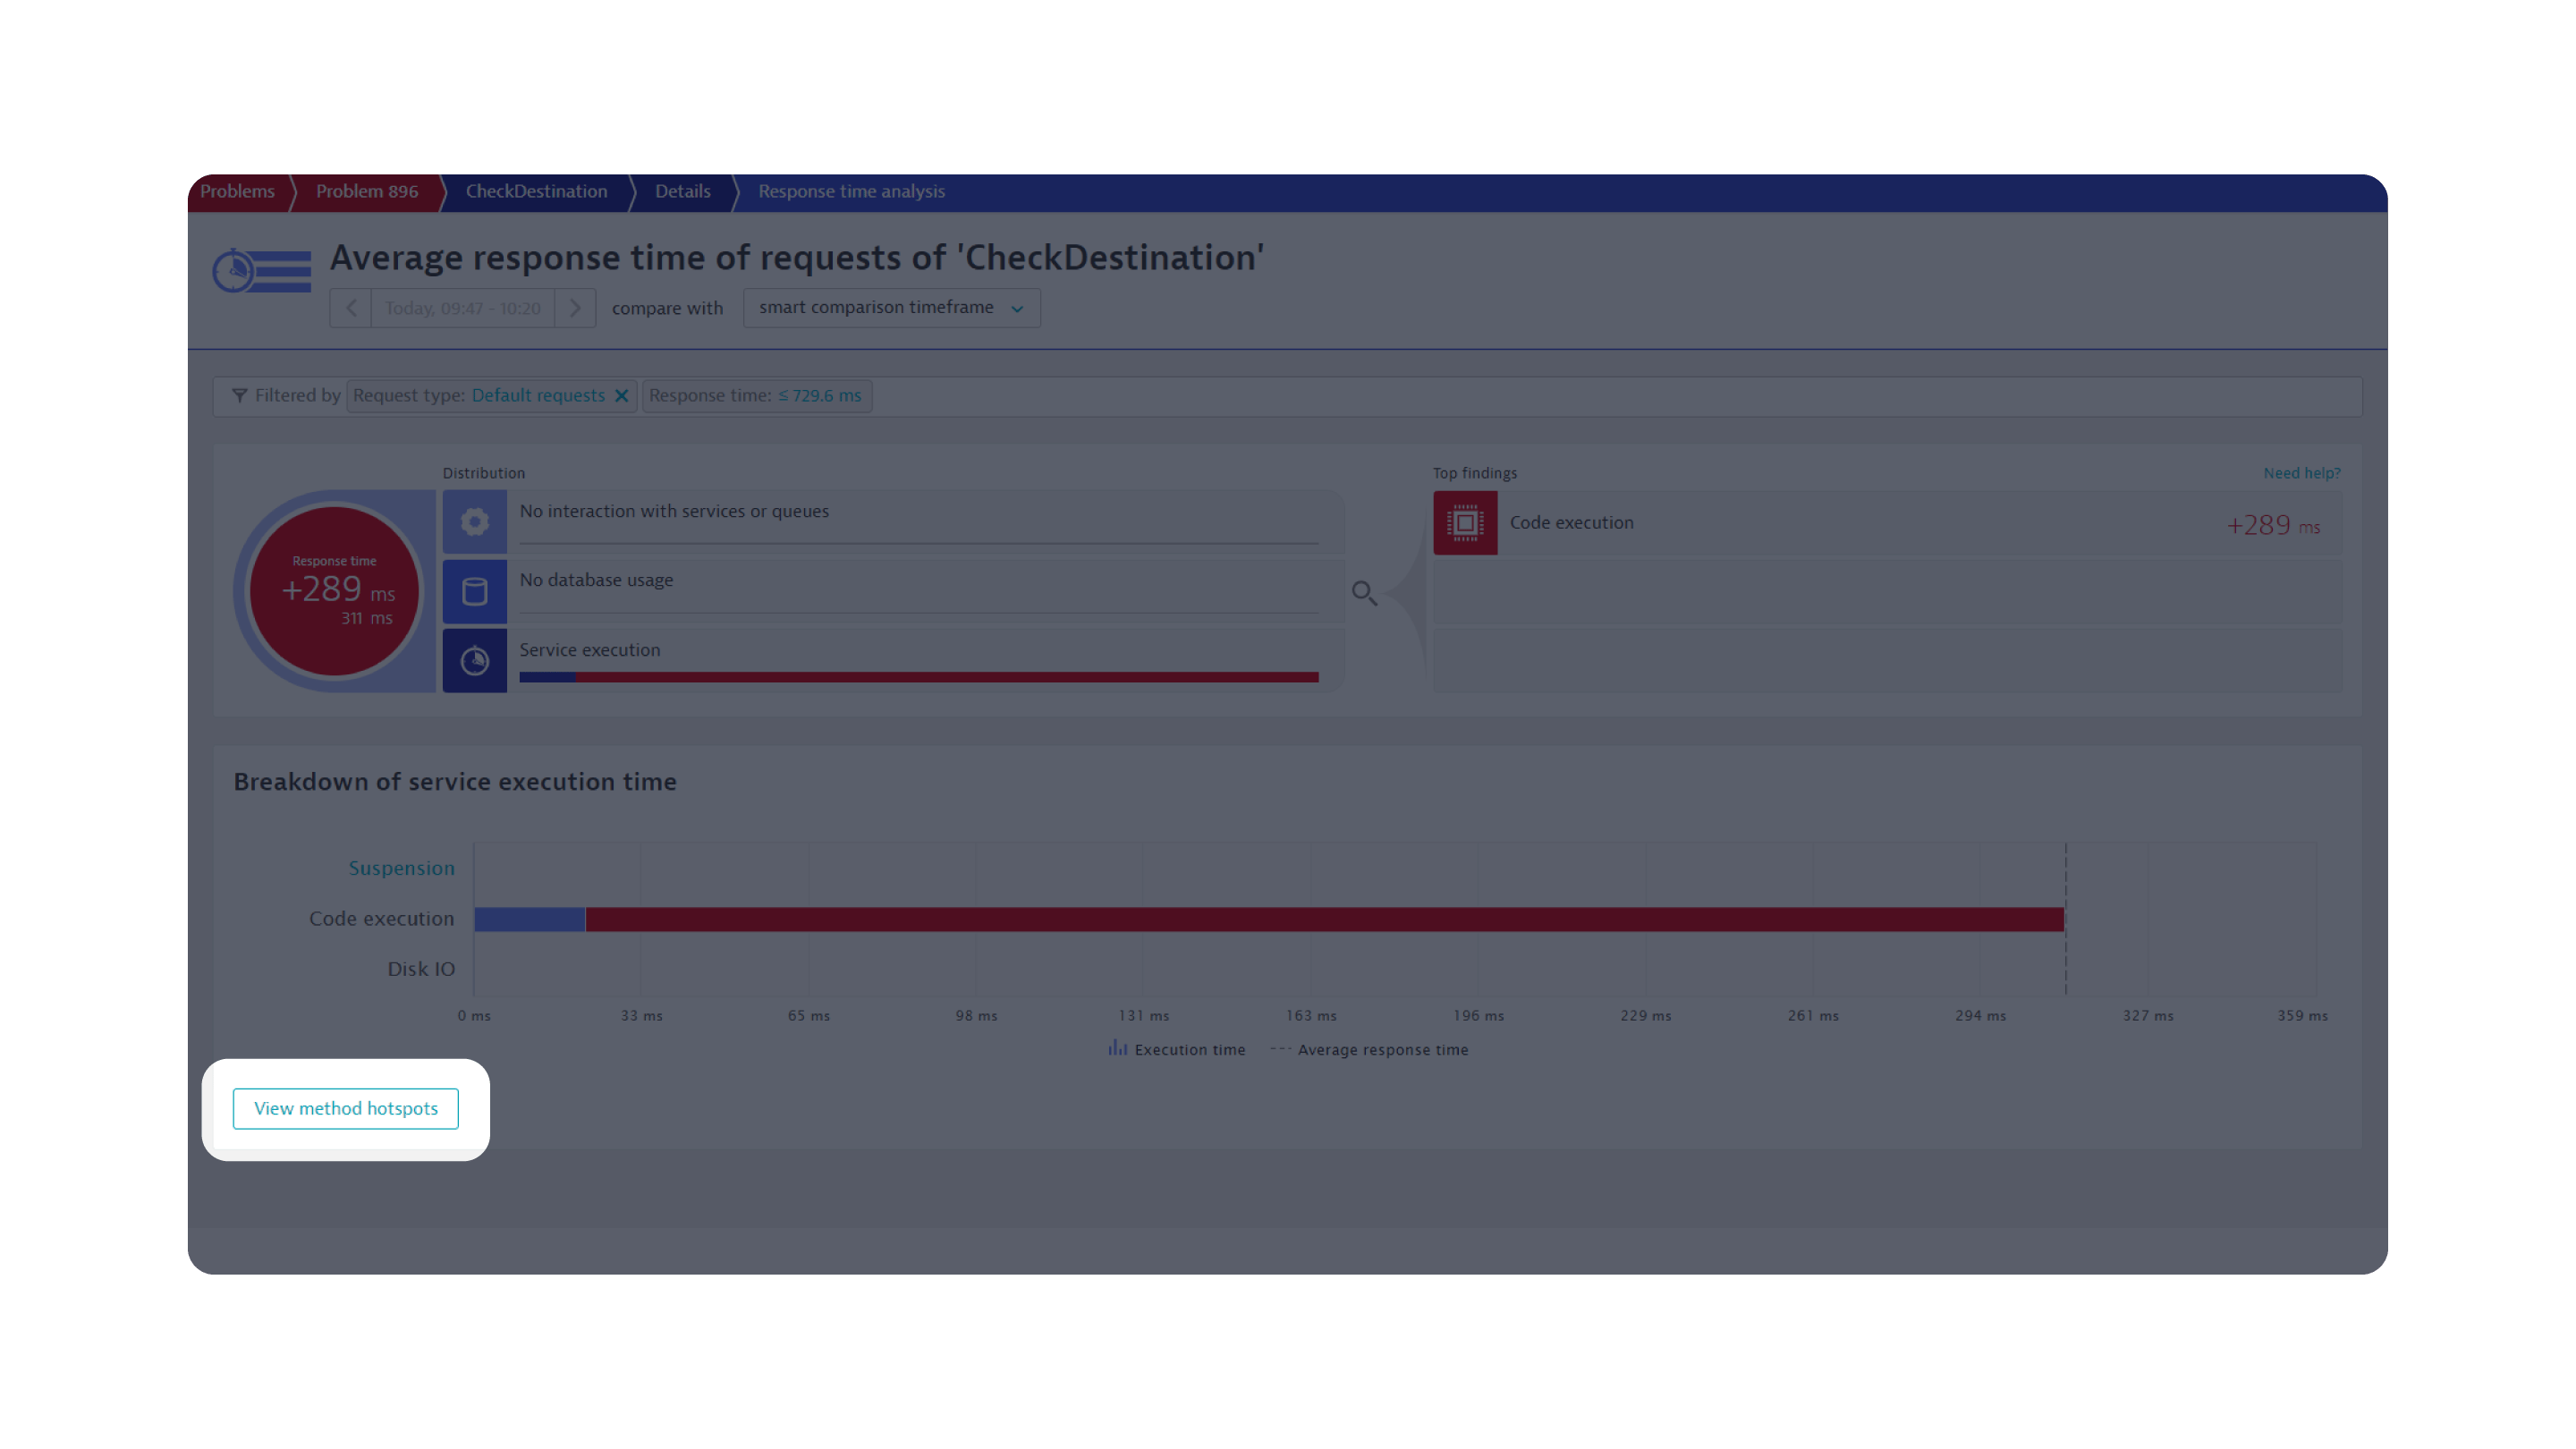
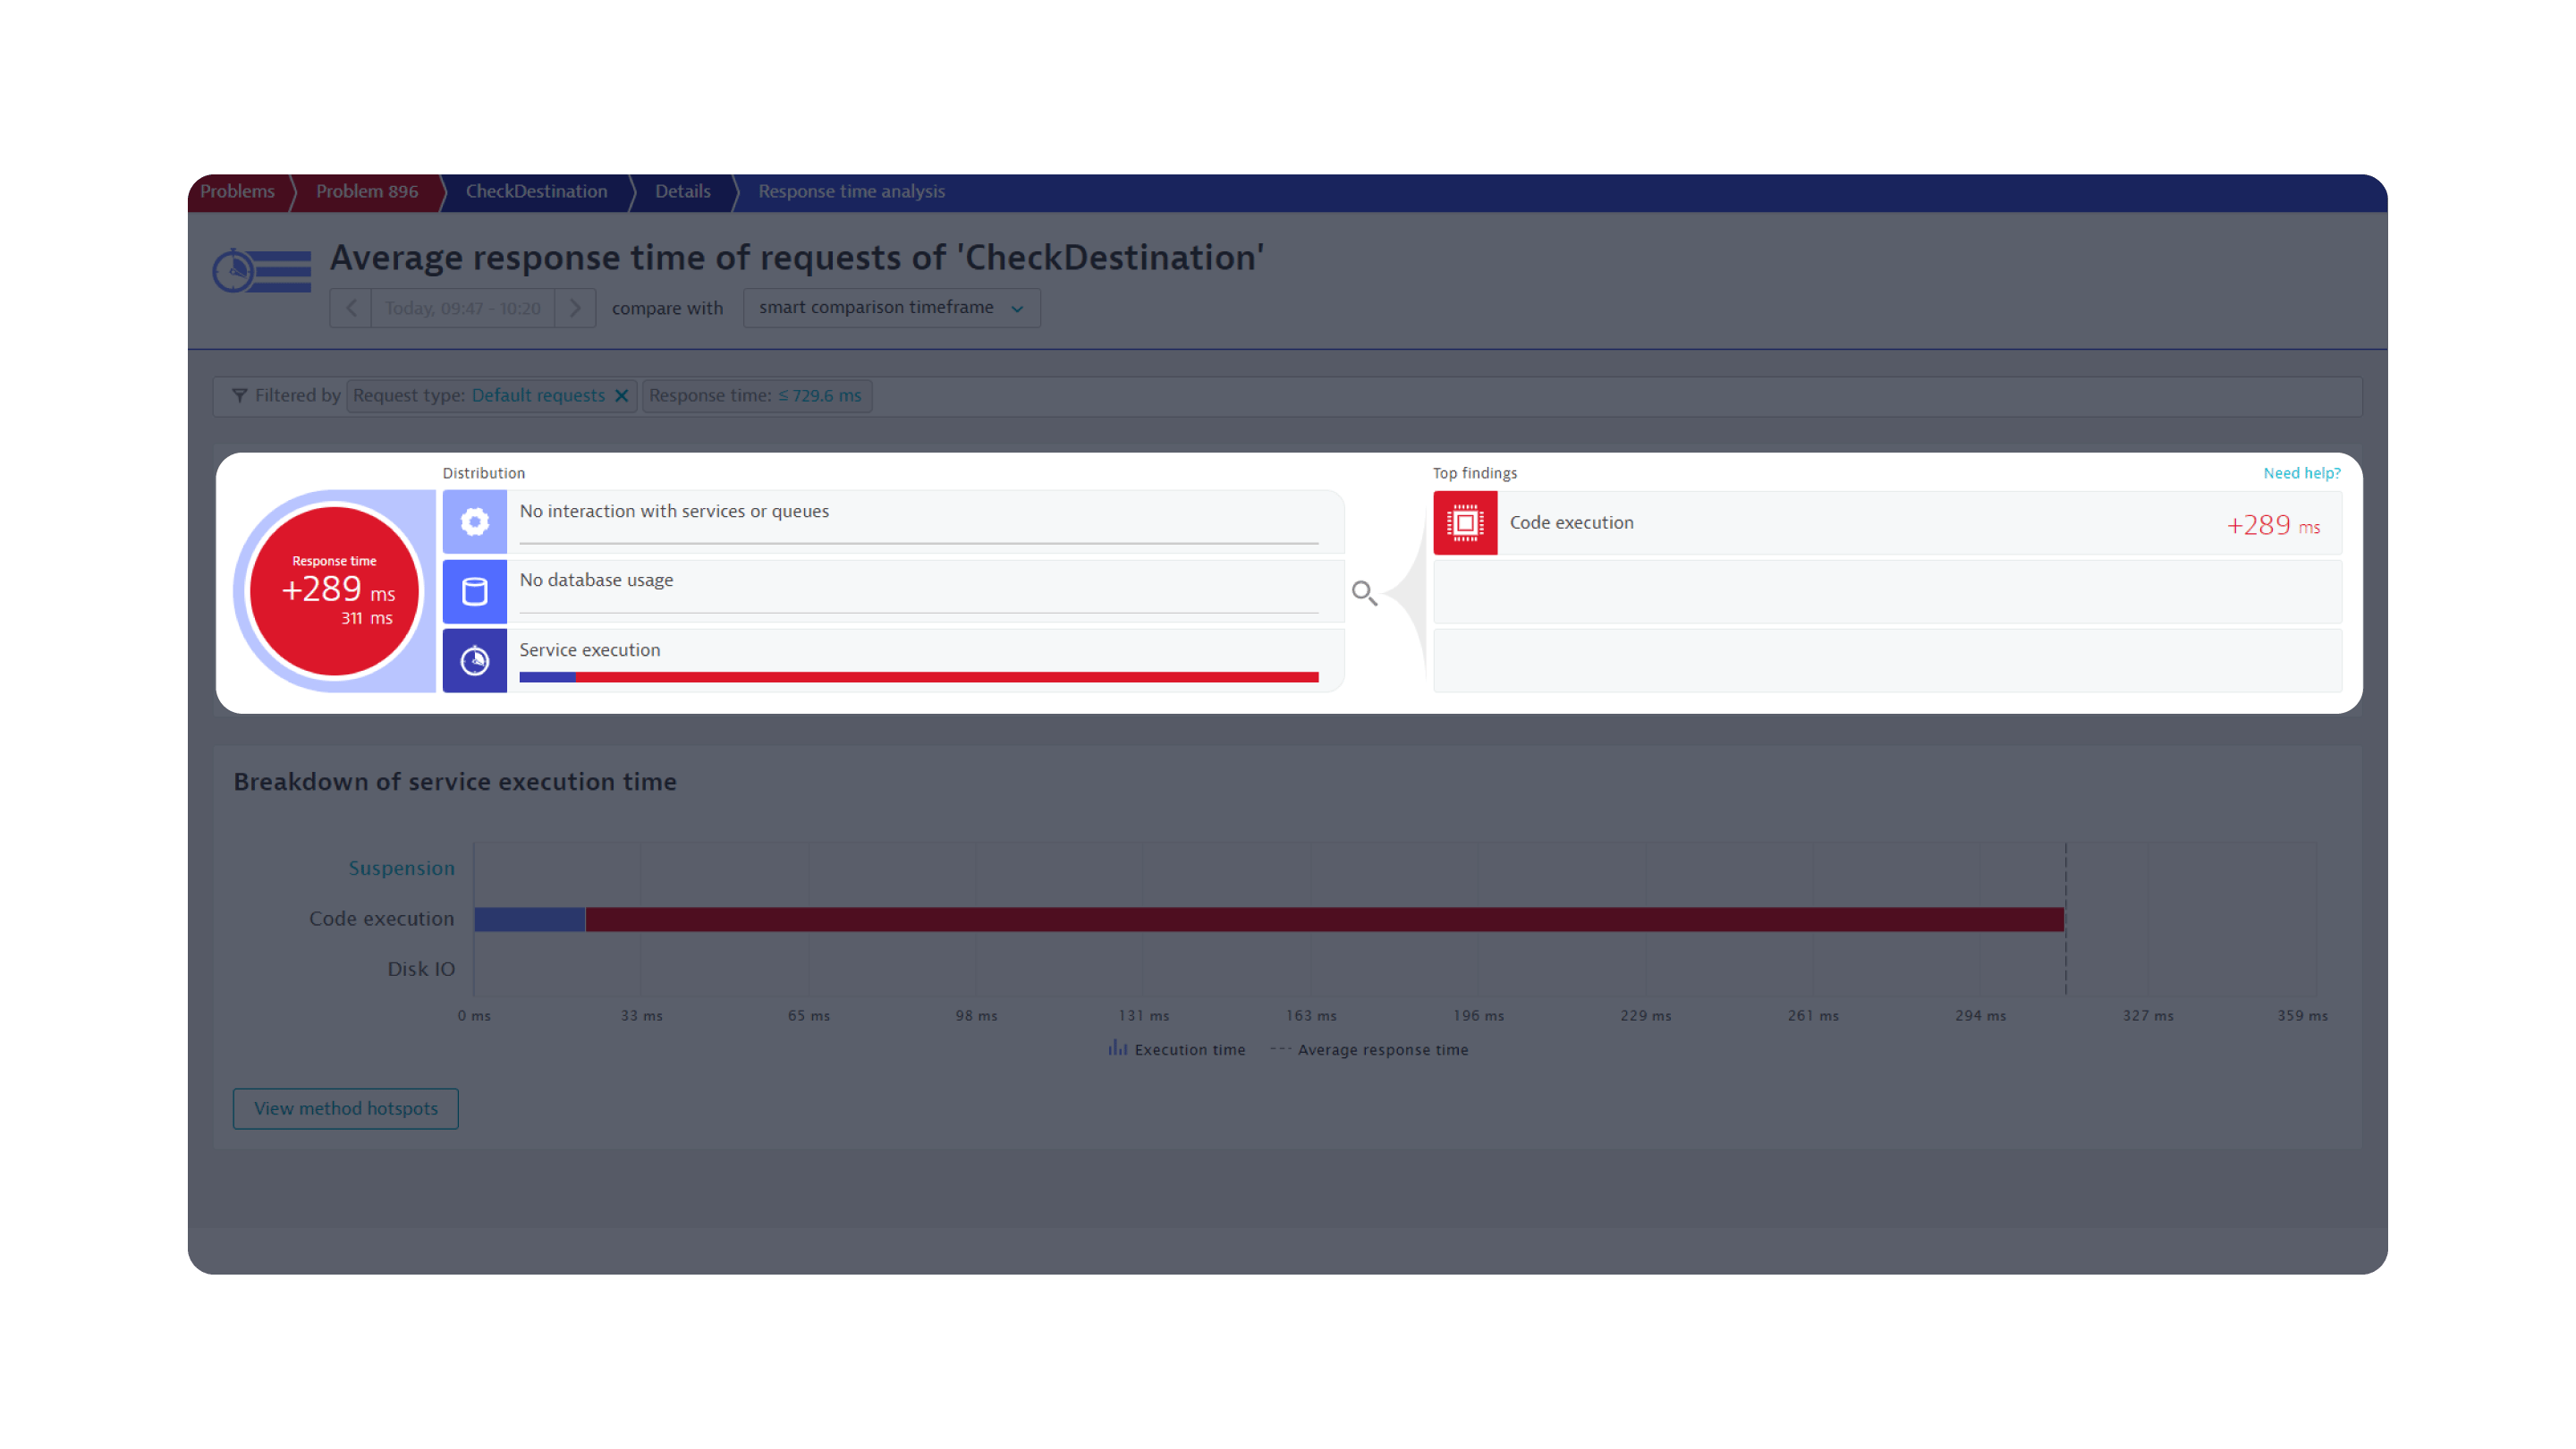
Dynatrace’s AI and automation instantly makes your team more proactive. Here, Dynatrace automatically identifies an anomaly in code execution time as the key contributor to the degraded CheckDestination response time.
Analyzing response time
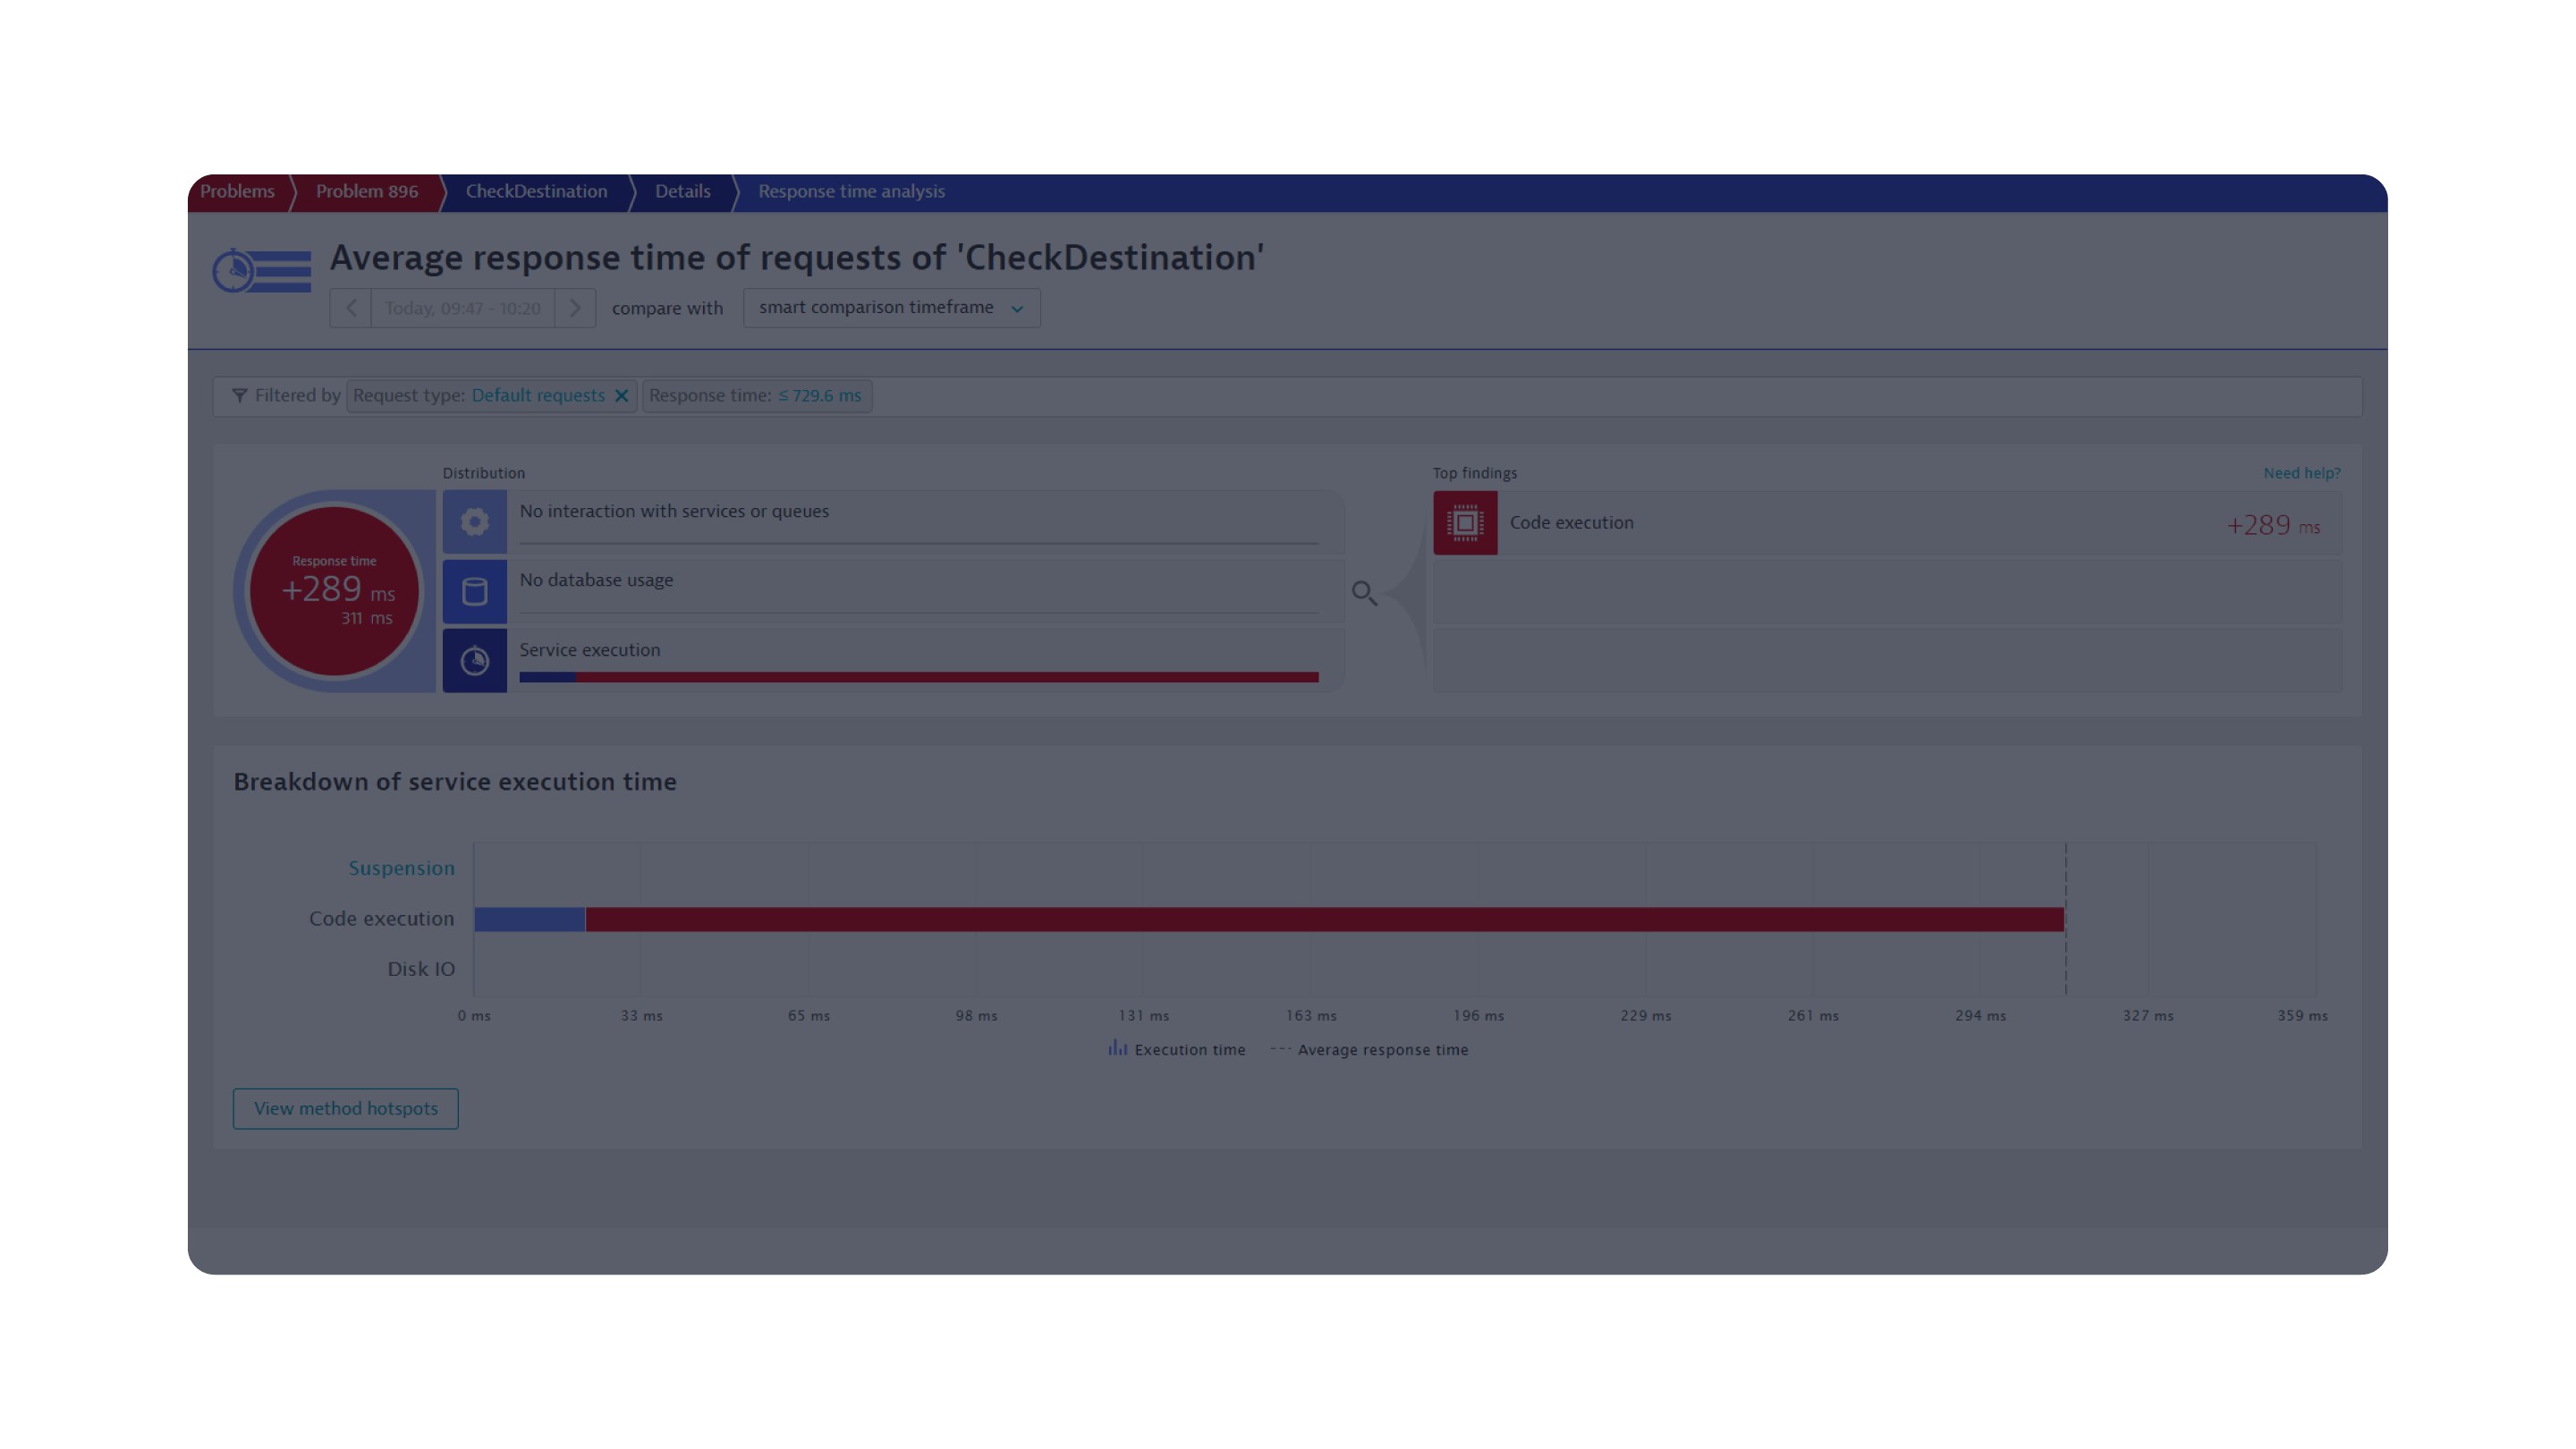
Click next to analyze code execution and identify hotspots.
2/2
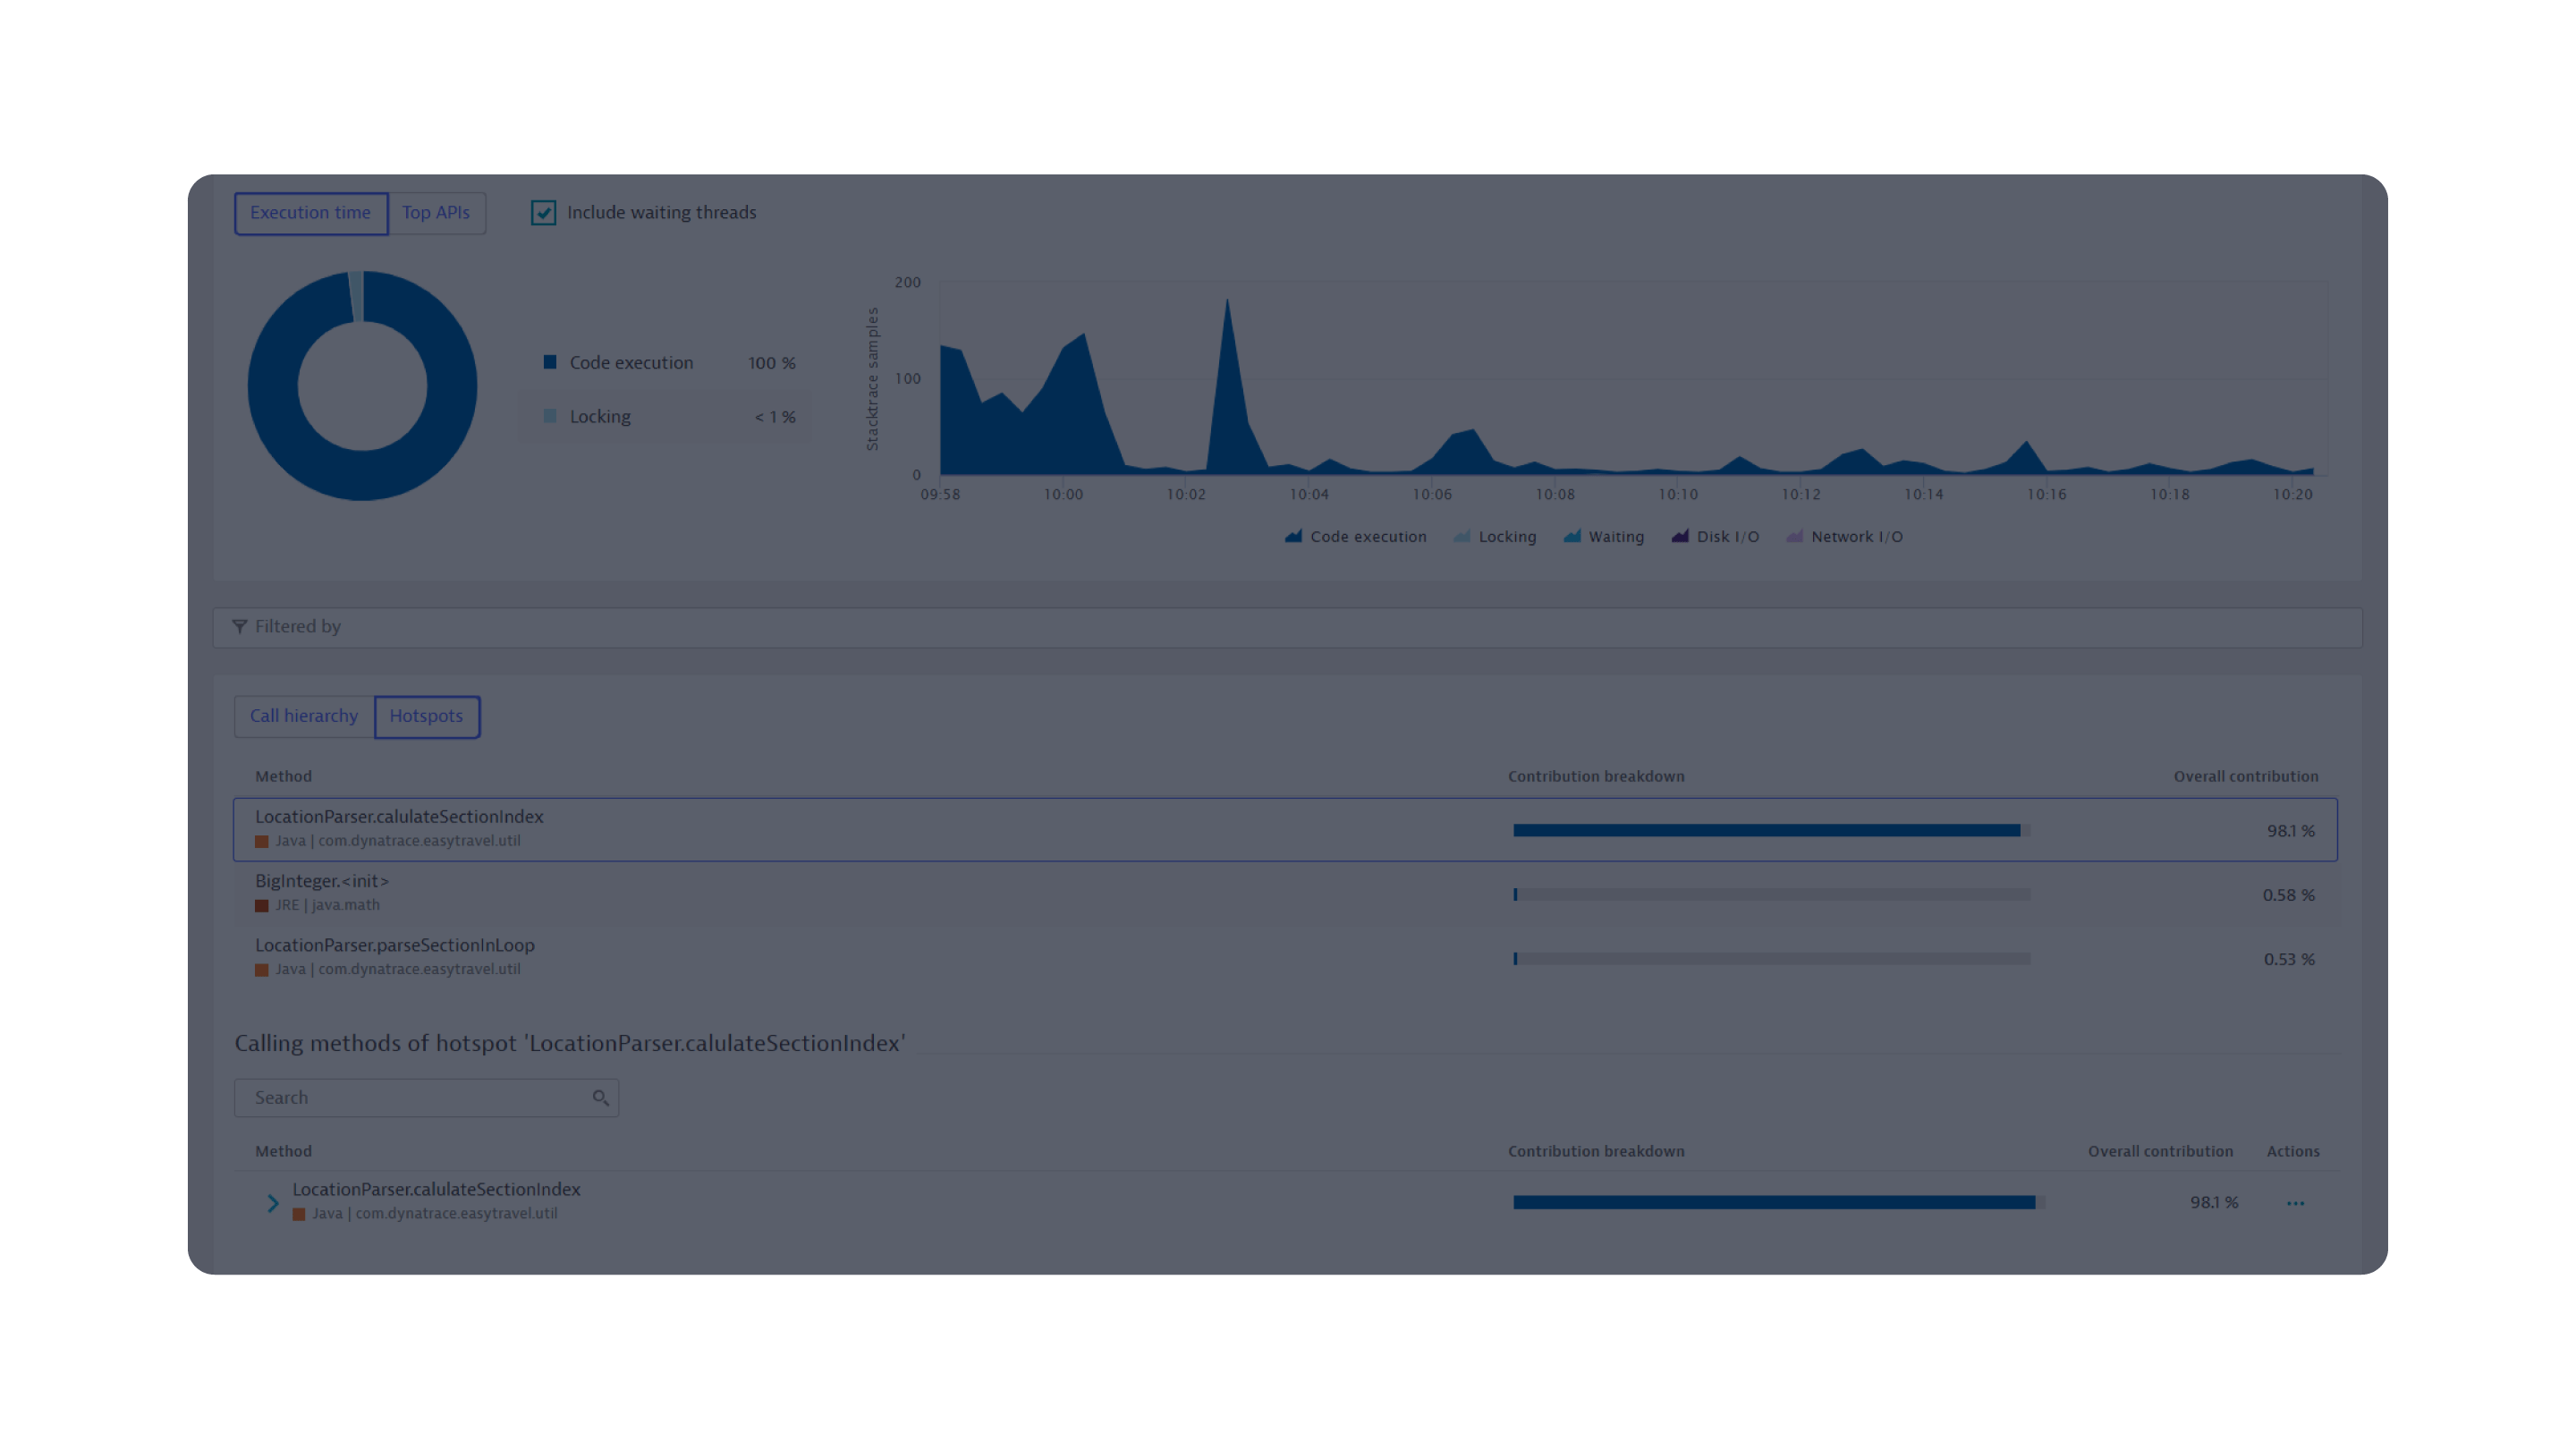
Immediately understand how much time is contributed by calls to other services and databases, and code-level execution, under Distribution, as well as the biggest hotspots under Top findings.
1/2
Response Time Analysis
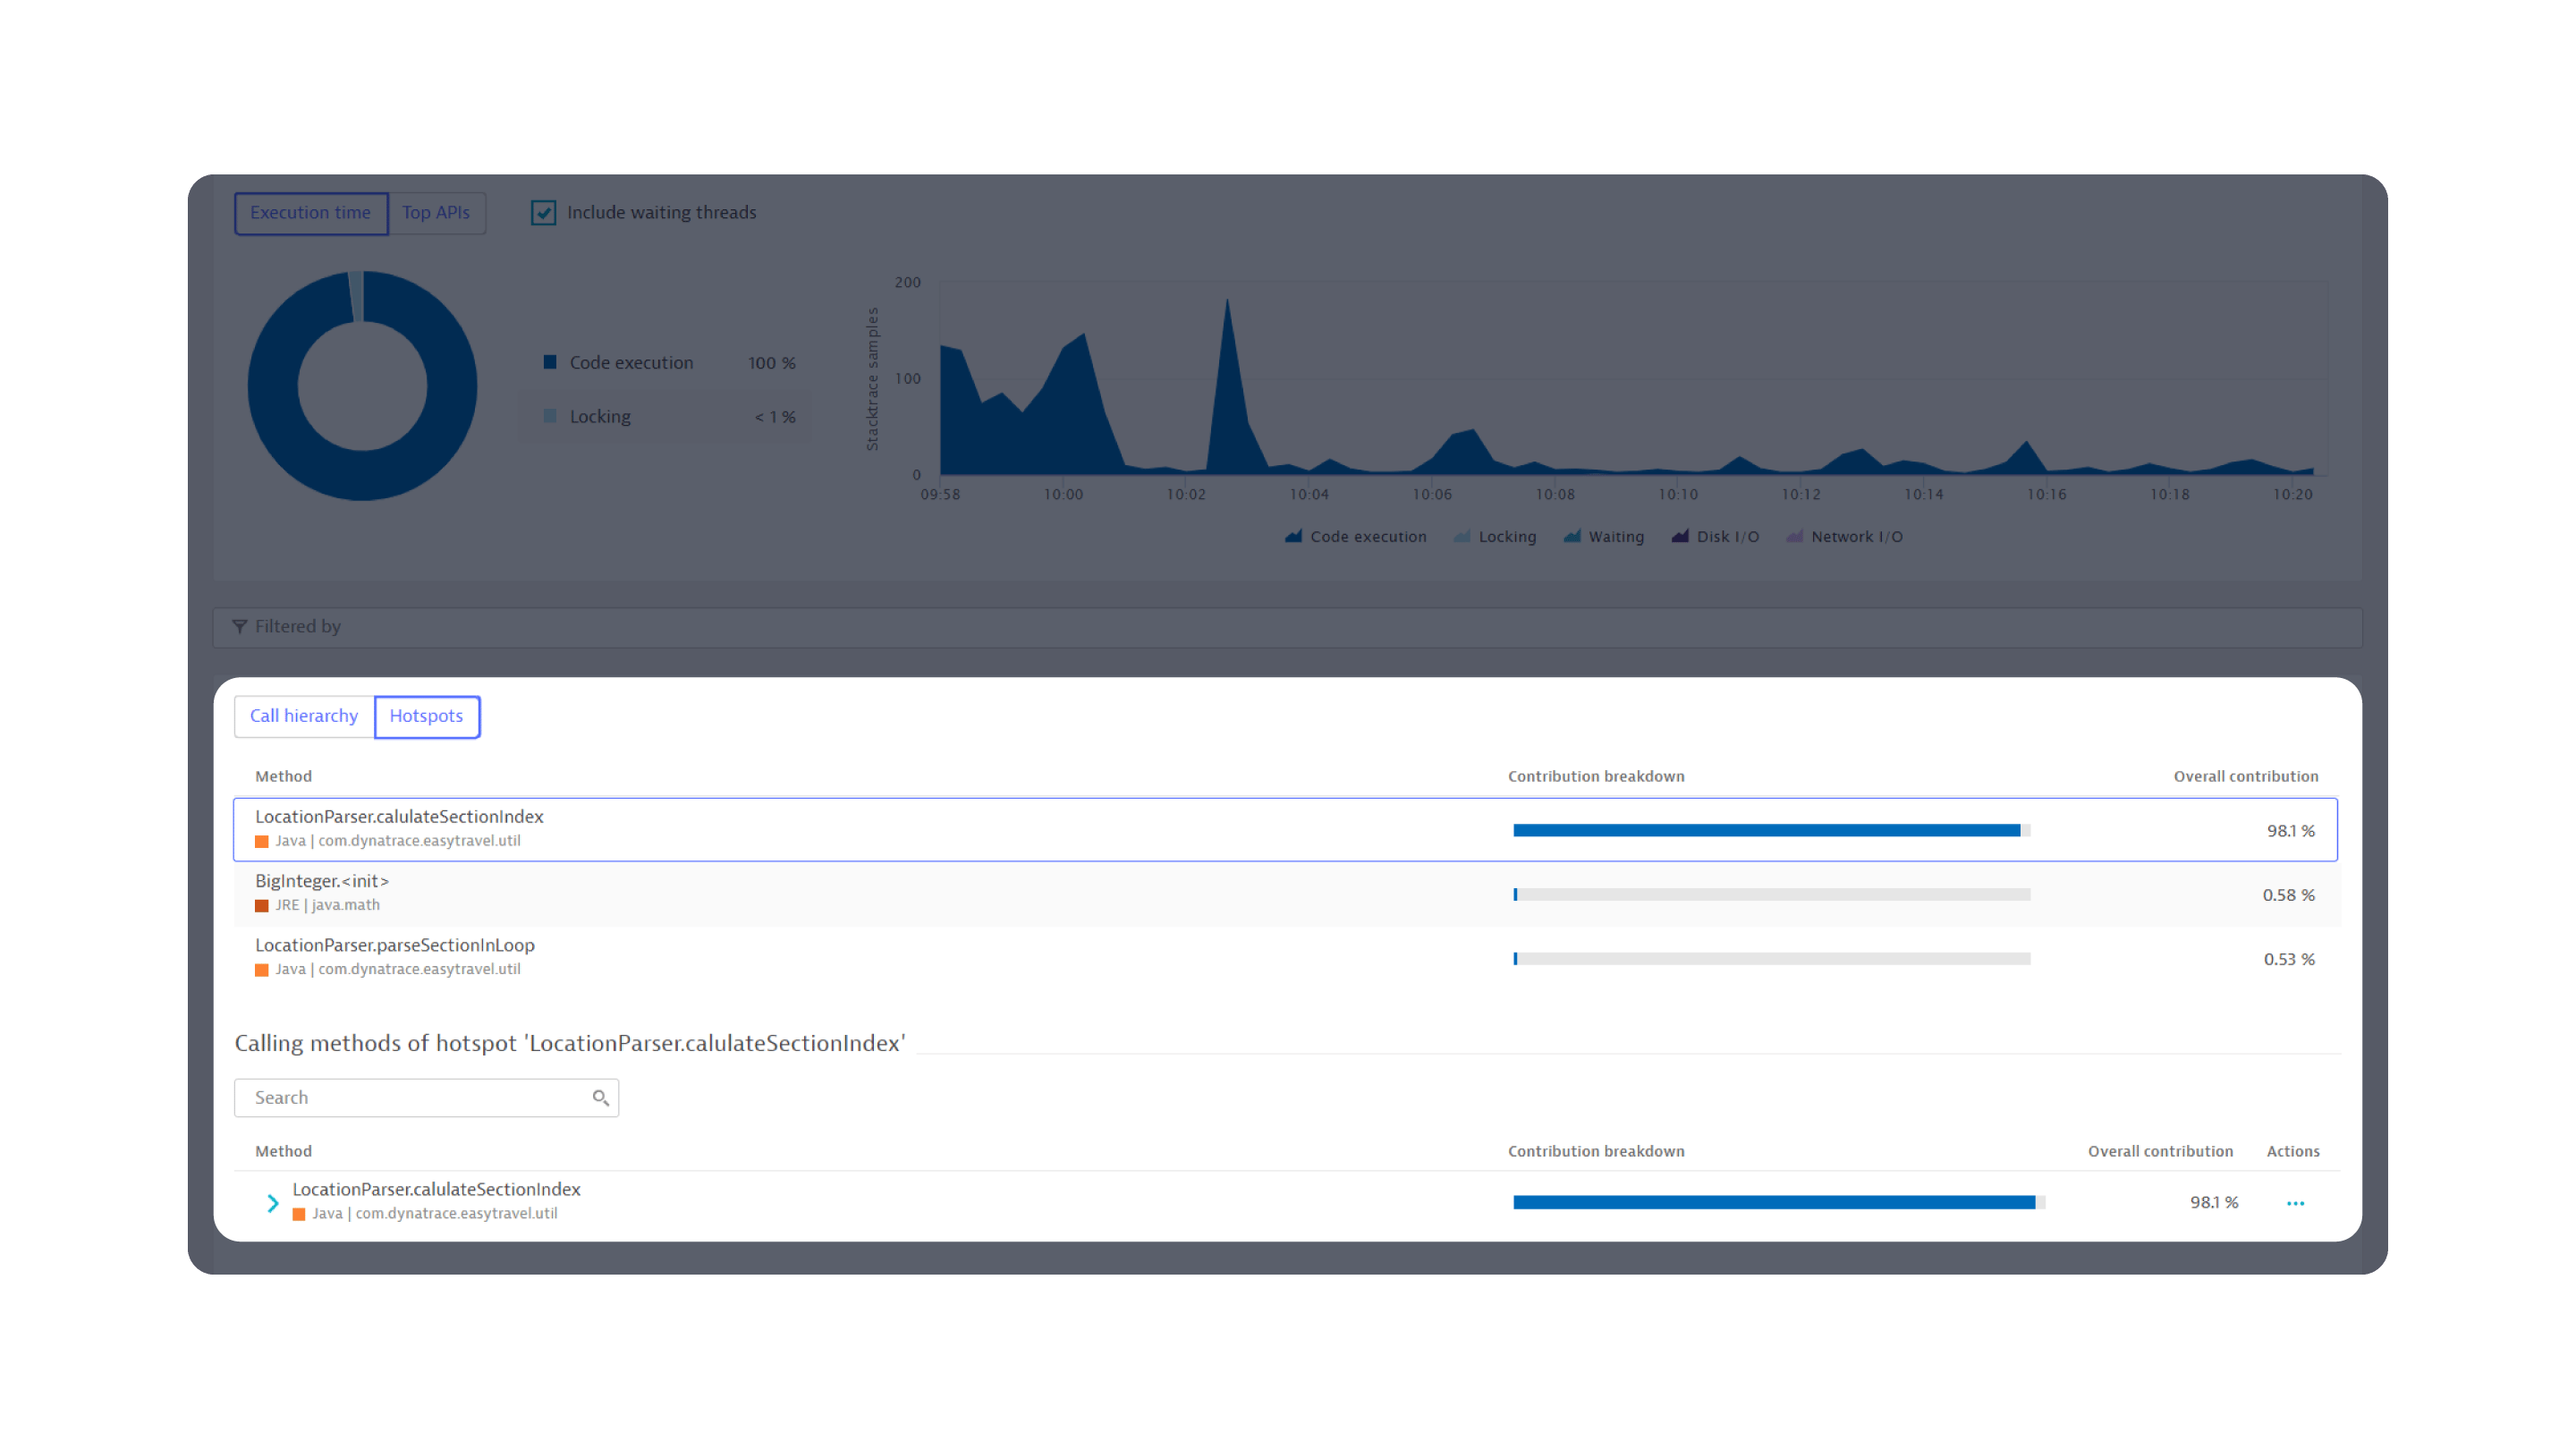
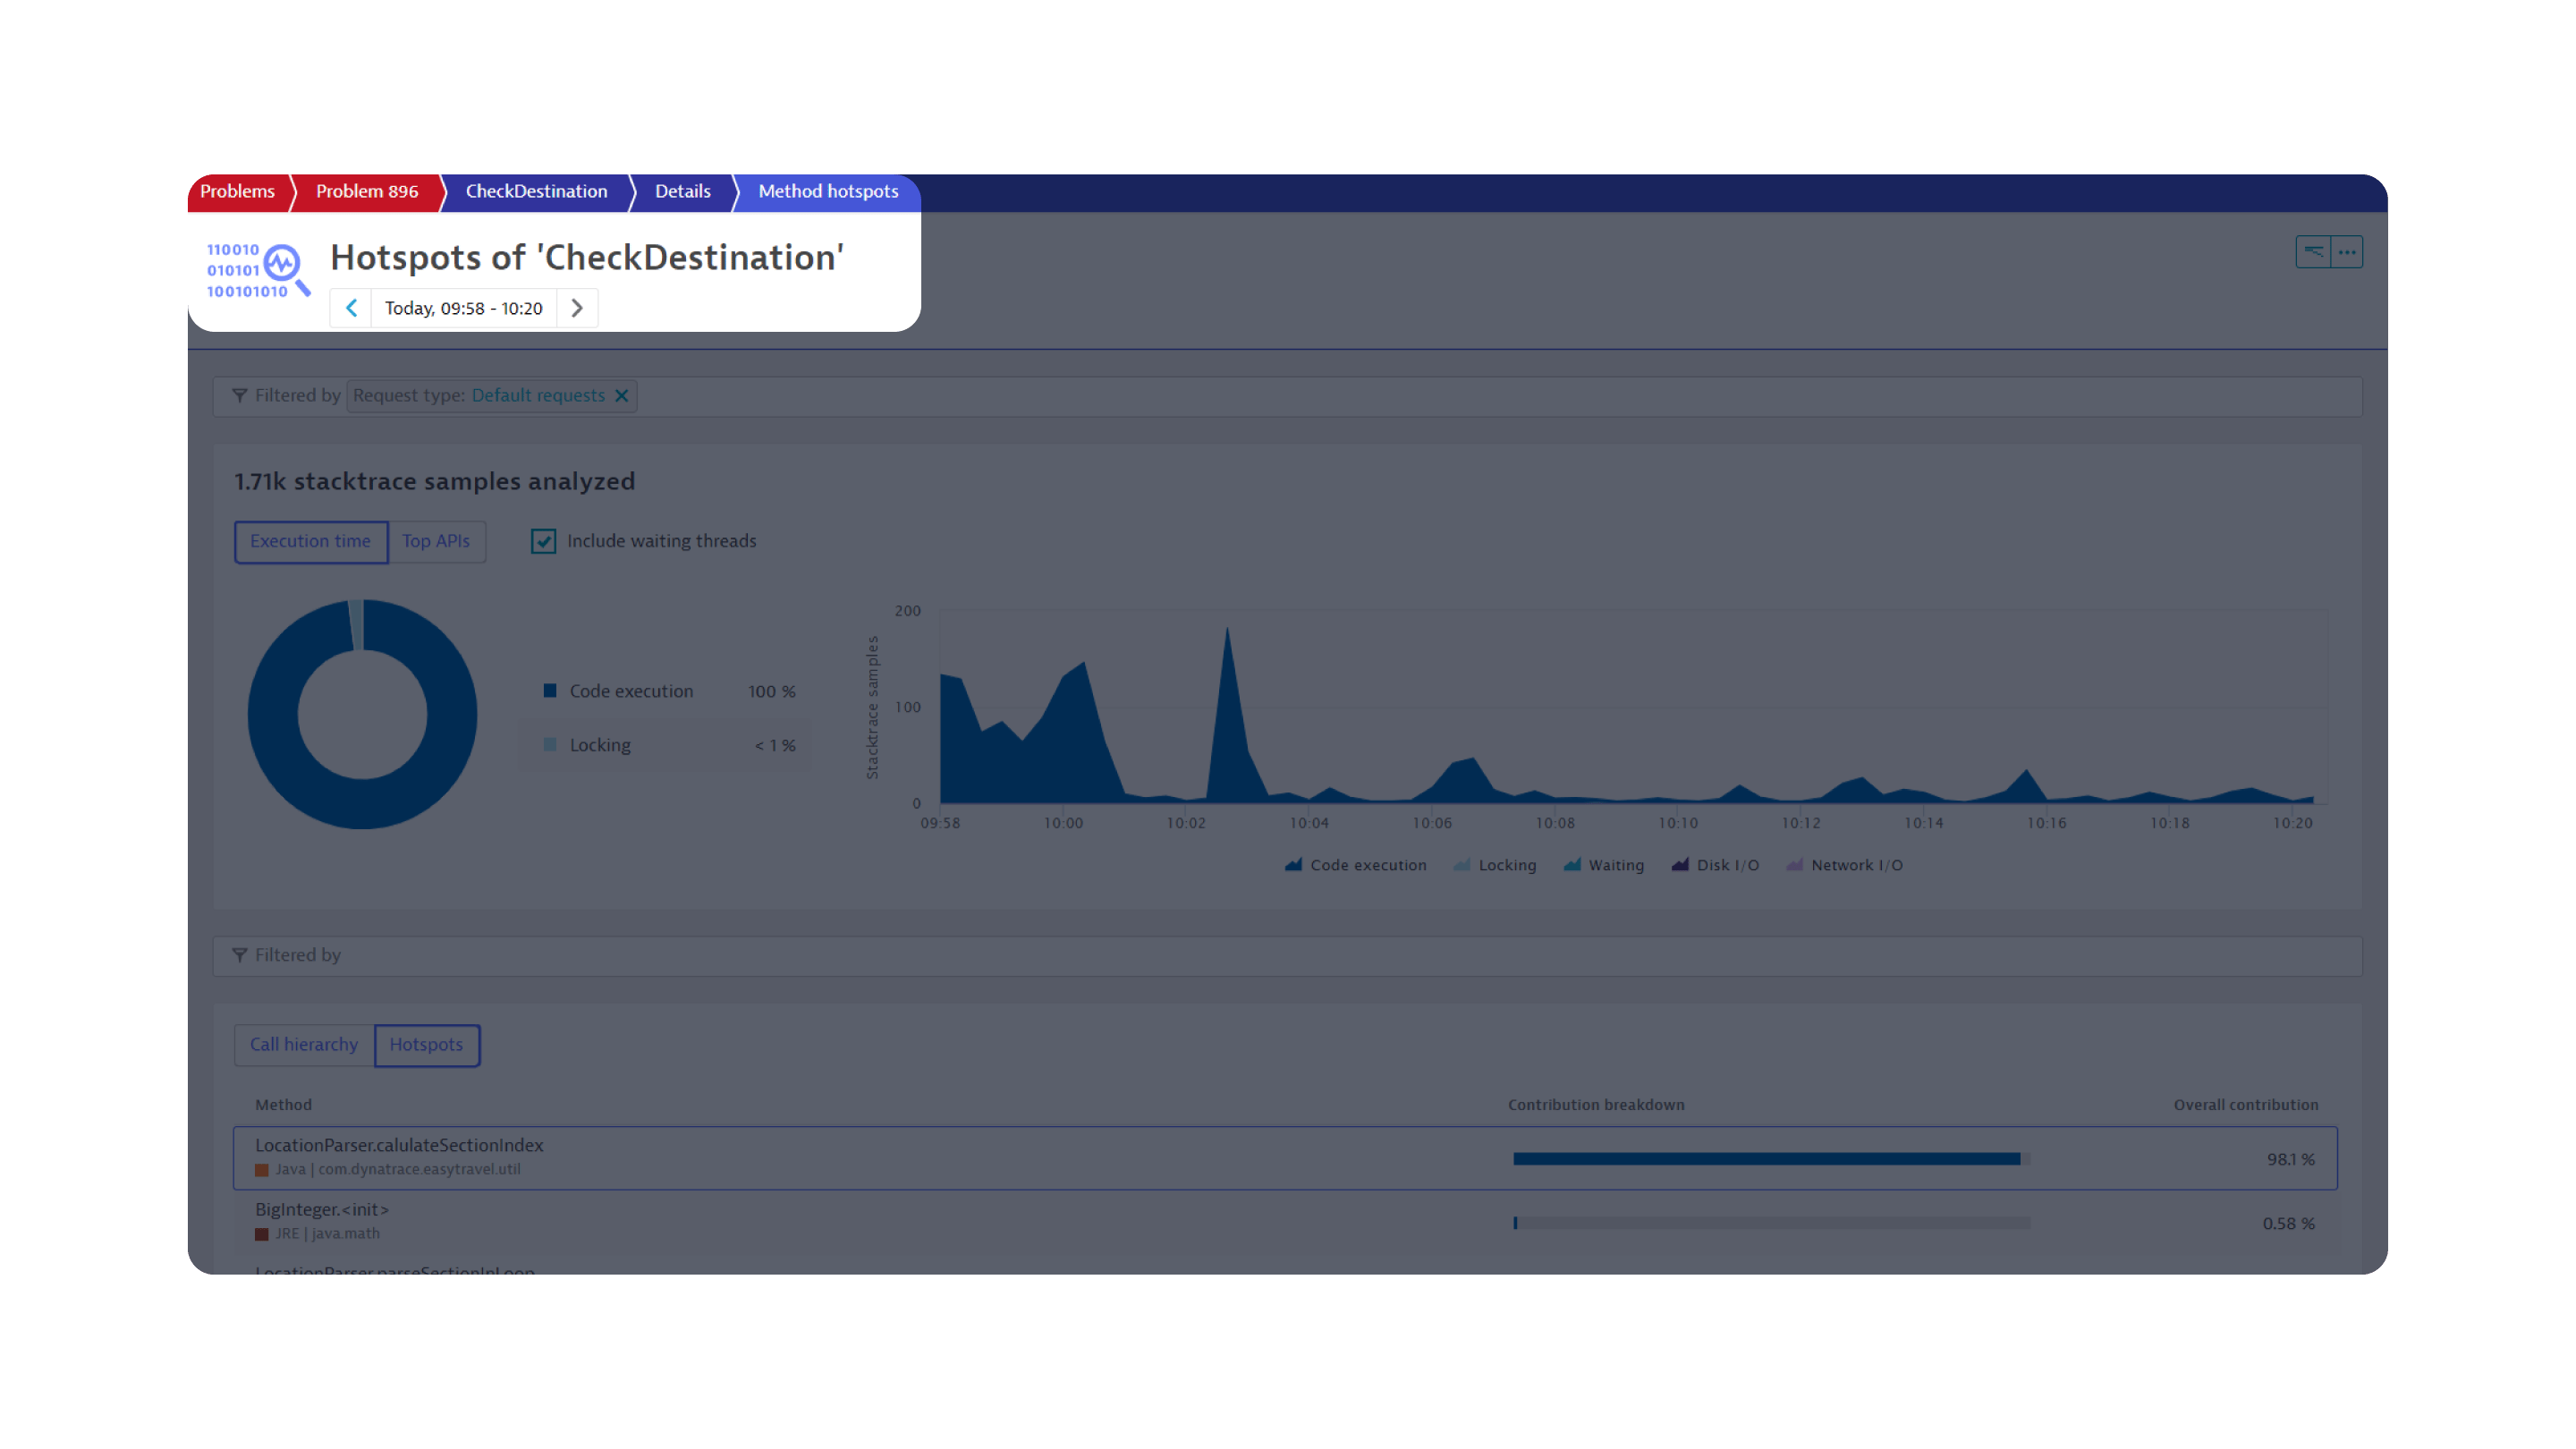
Manually searching through thousands of lines of code is inefficient, frustrating, and risky. Here, method hotspots automatically checks all the classes and methods executed to run the service under the call tree, and identifies LocationParser.parseSectionIndex as responsible for the problem.
Exploring method hotspots
Click next to continue and explore the impact on other services and verify root cause.
Dynatrace presents precise, code-level information to find the cause of the issue – in this case, the LocationParser.parseSectionIndex method.
Method Hotspots
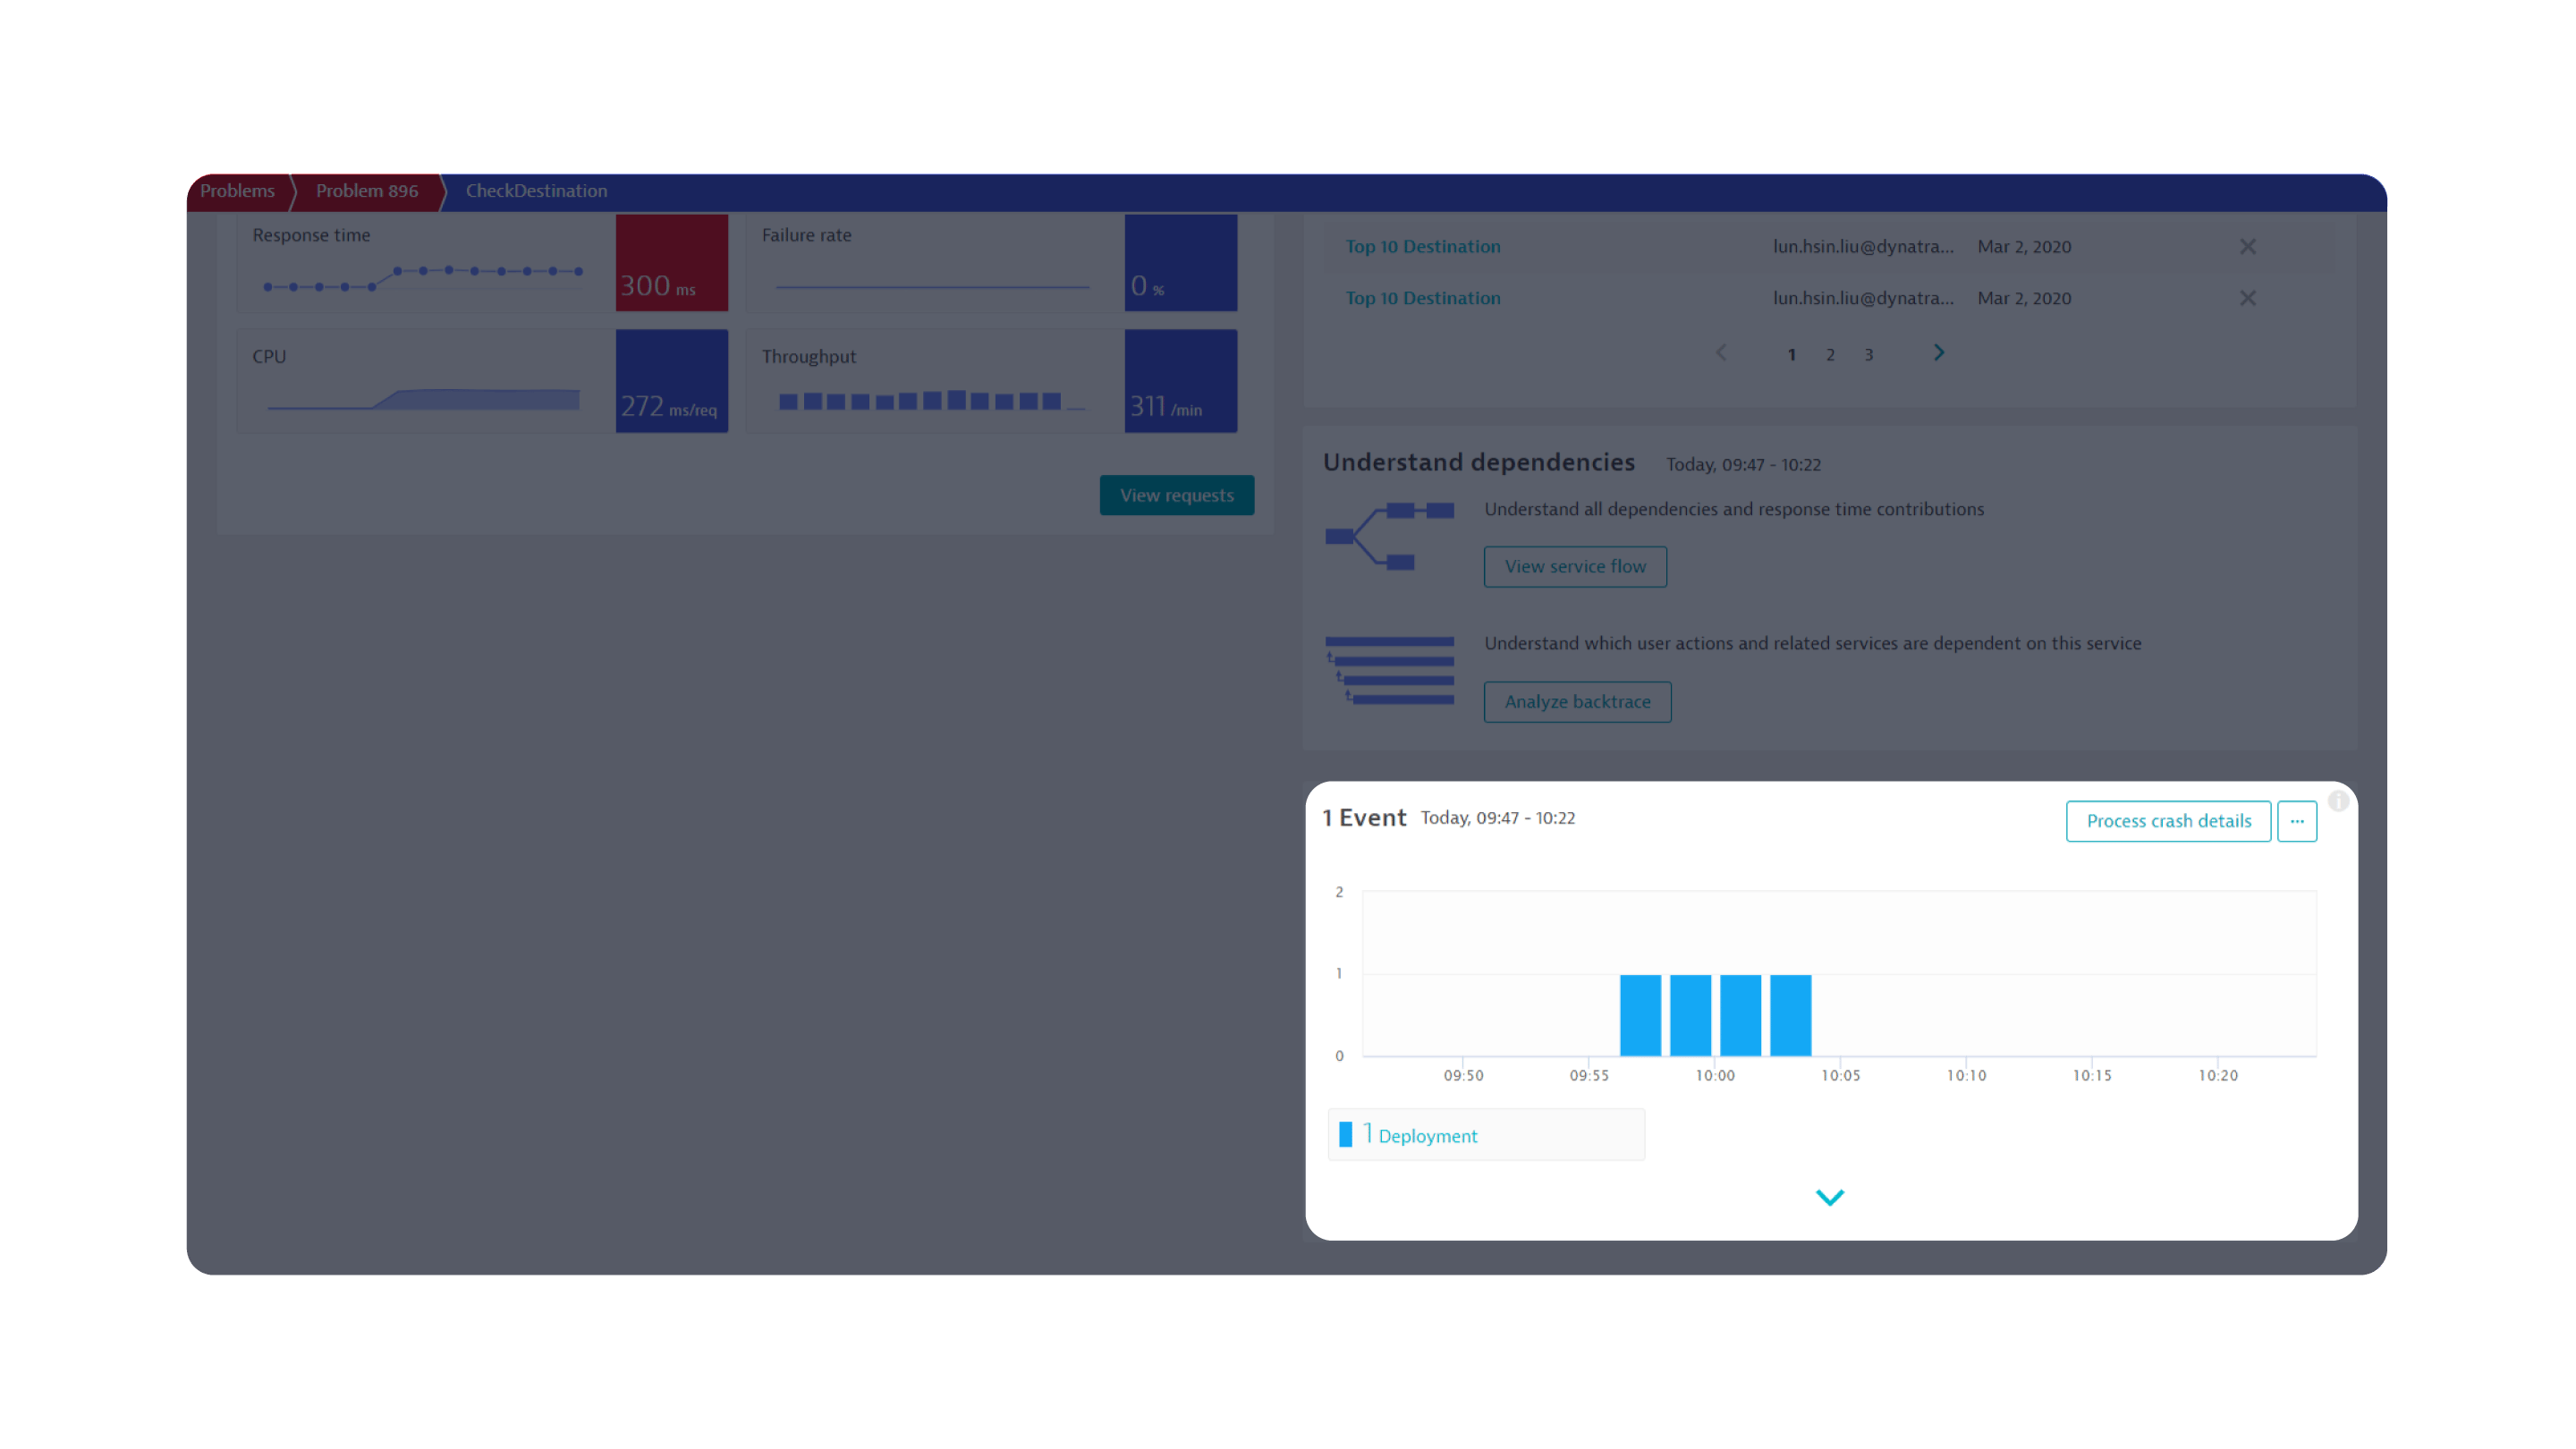
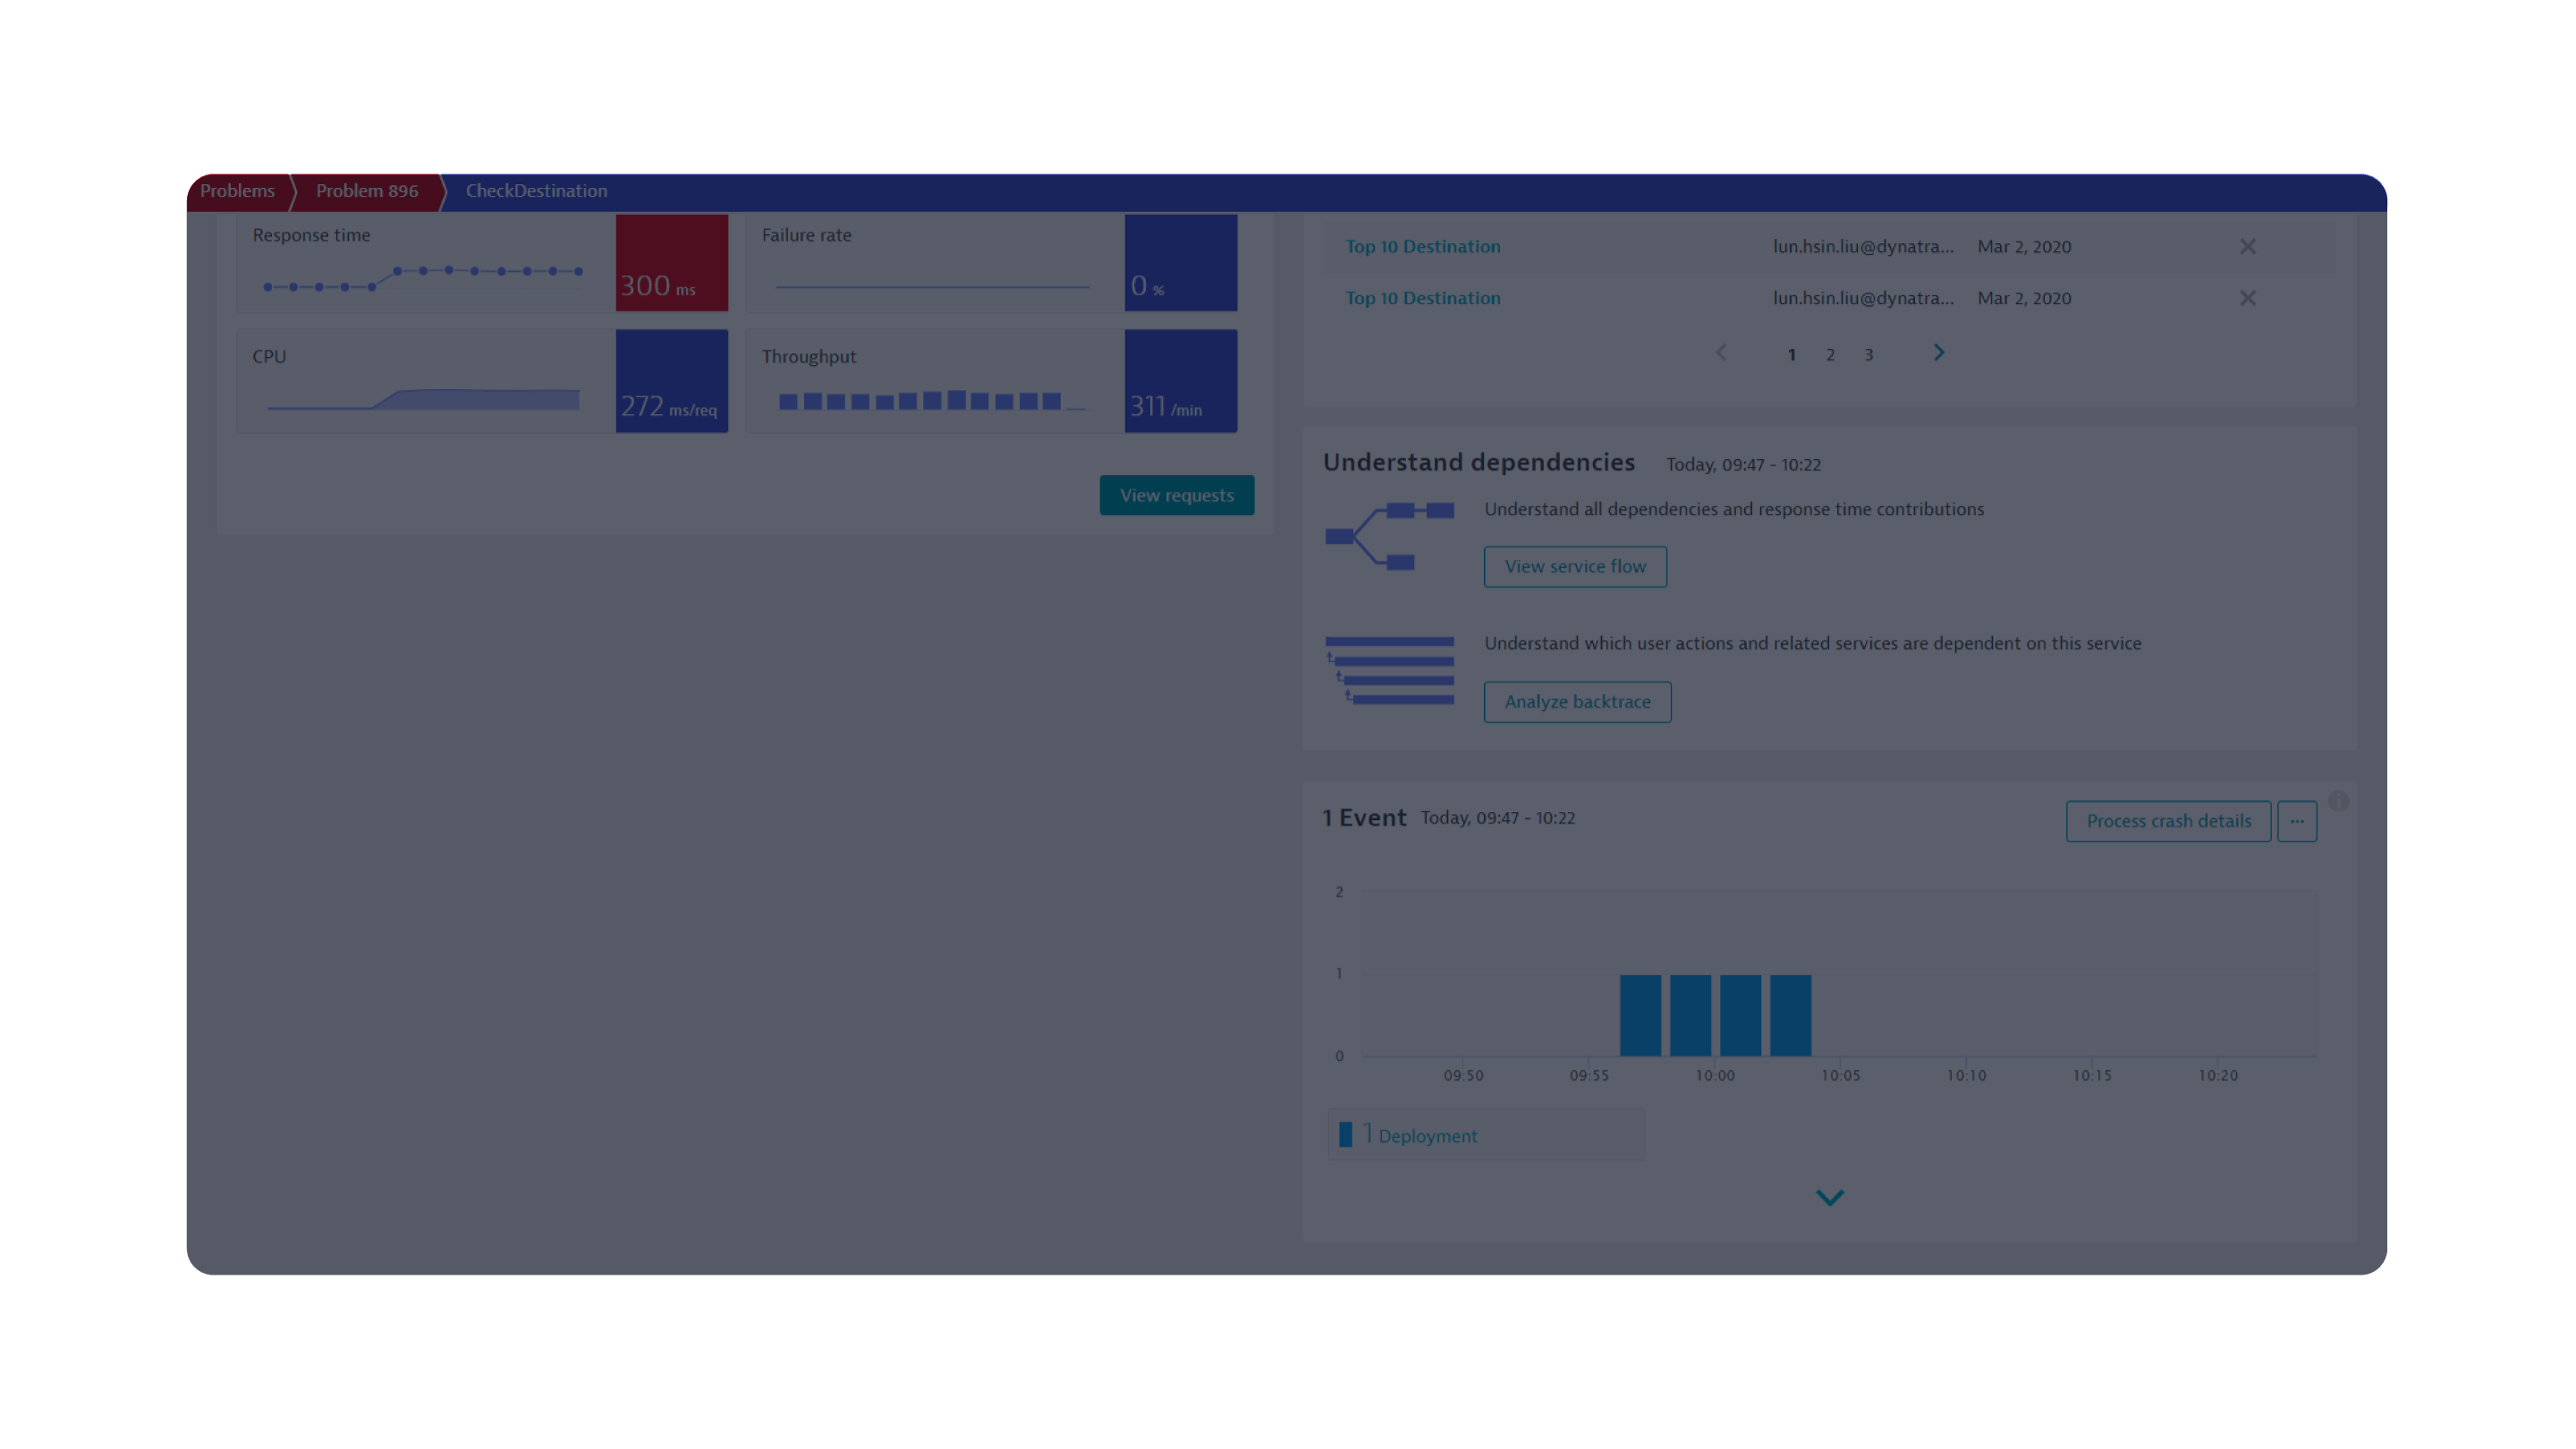
Because Dynatrace automatically understands service details, problem-specific service summaries quickly highlight the impact to the service and beyond, so teams don’t waste time scouring dashboards or chasing false positives. Here, we see that during the problem timeframe, service requests suffered response time and CPU consumption spikes.
Immediately understanding impact & importance
Click next to continue and analyze the backtrace.
Dynatrace highlights that a deployment occurred directly prior to the problem, as identified by Davis.
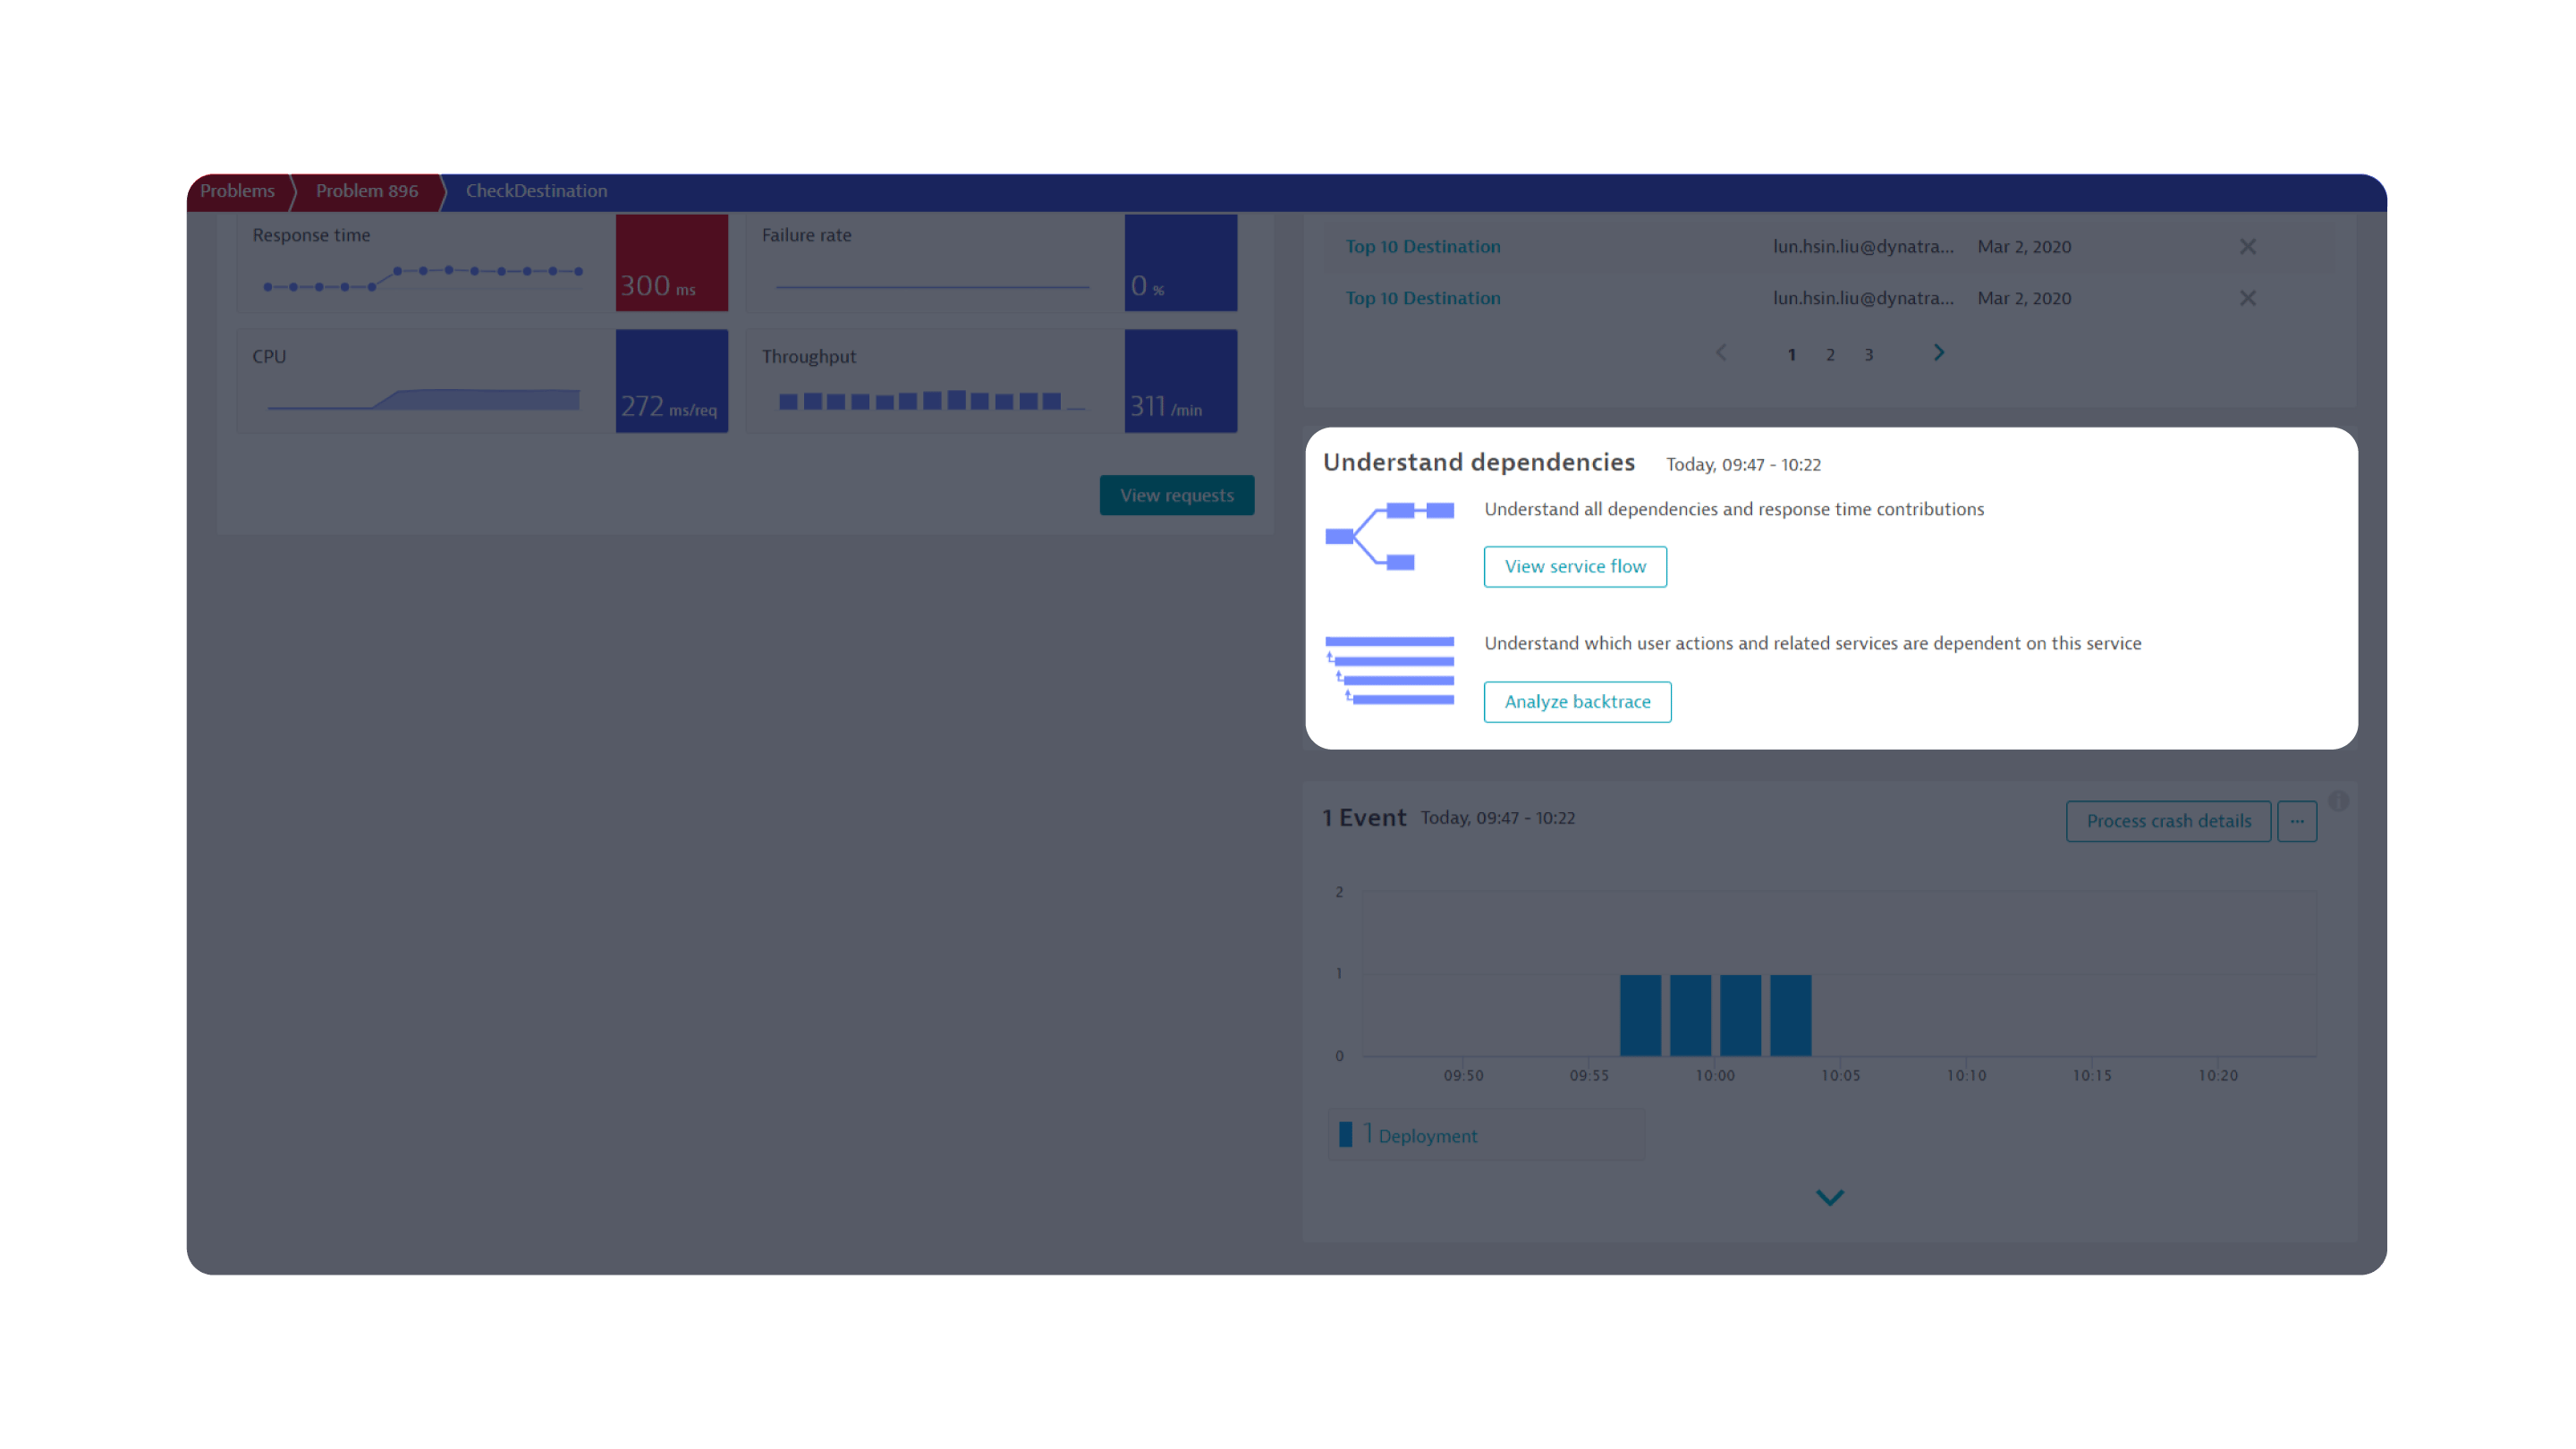
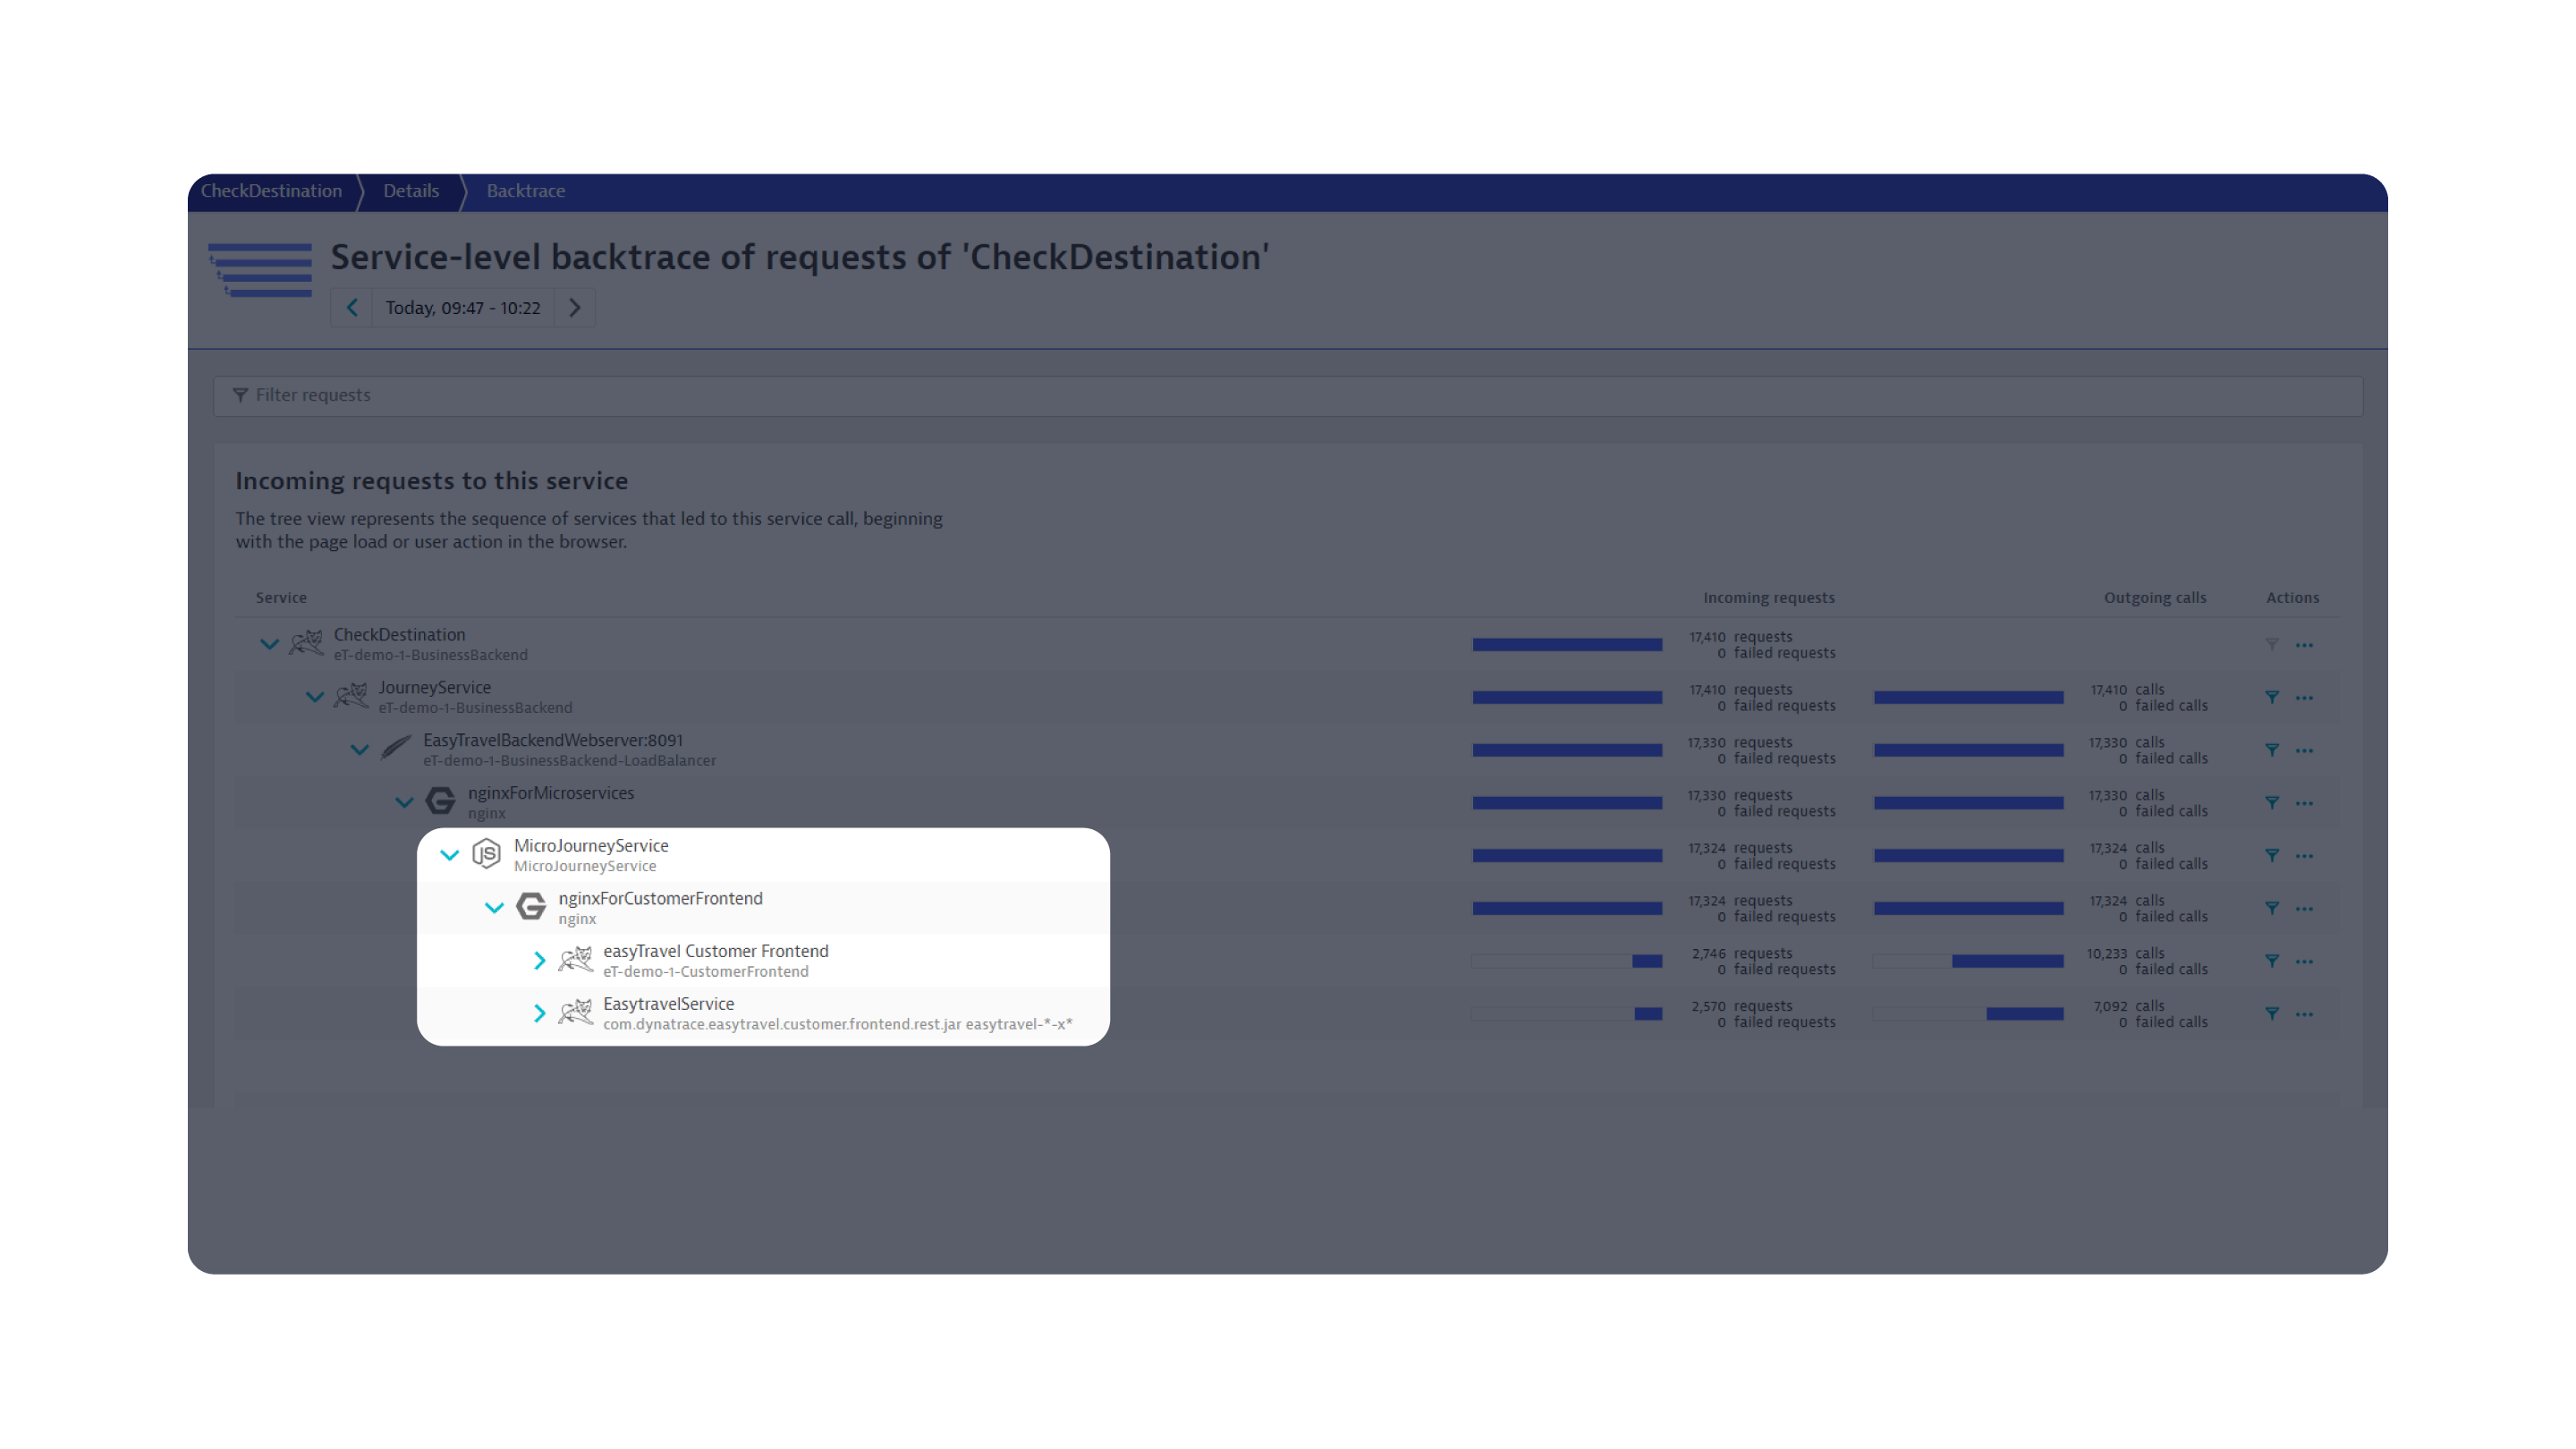
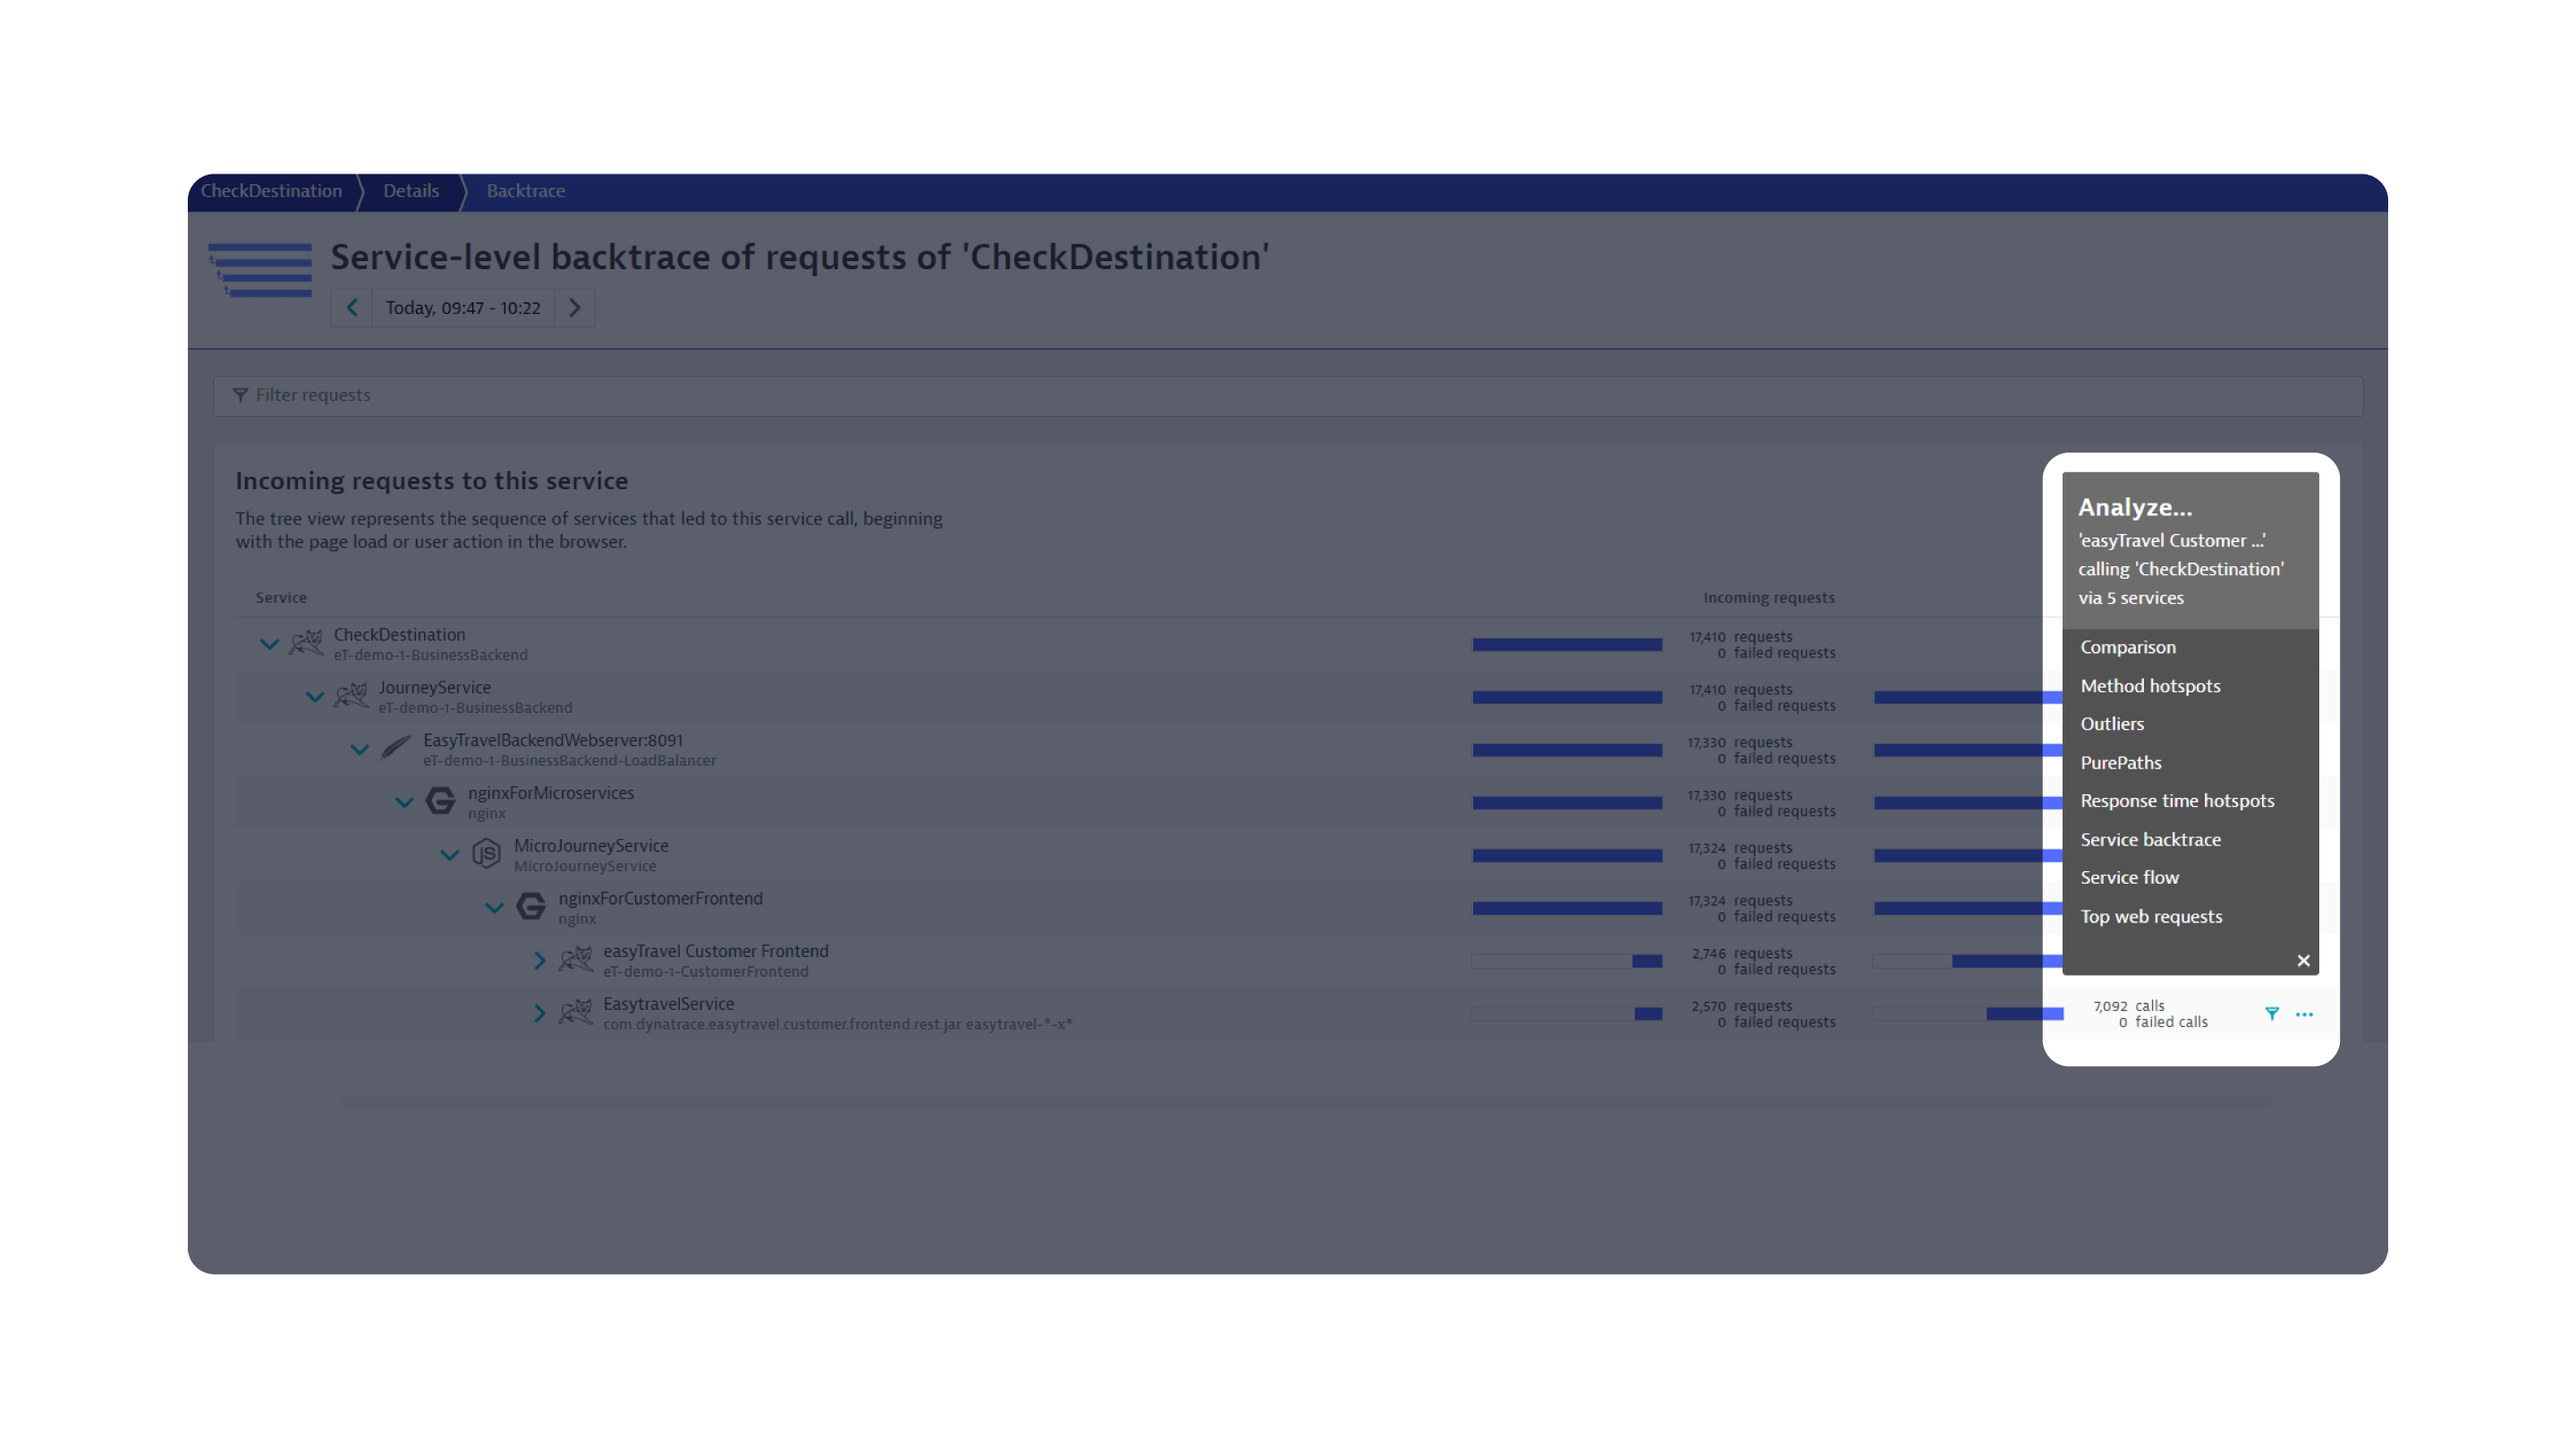
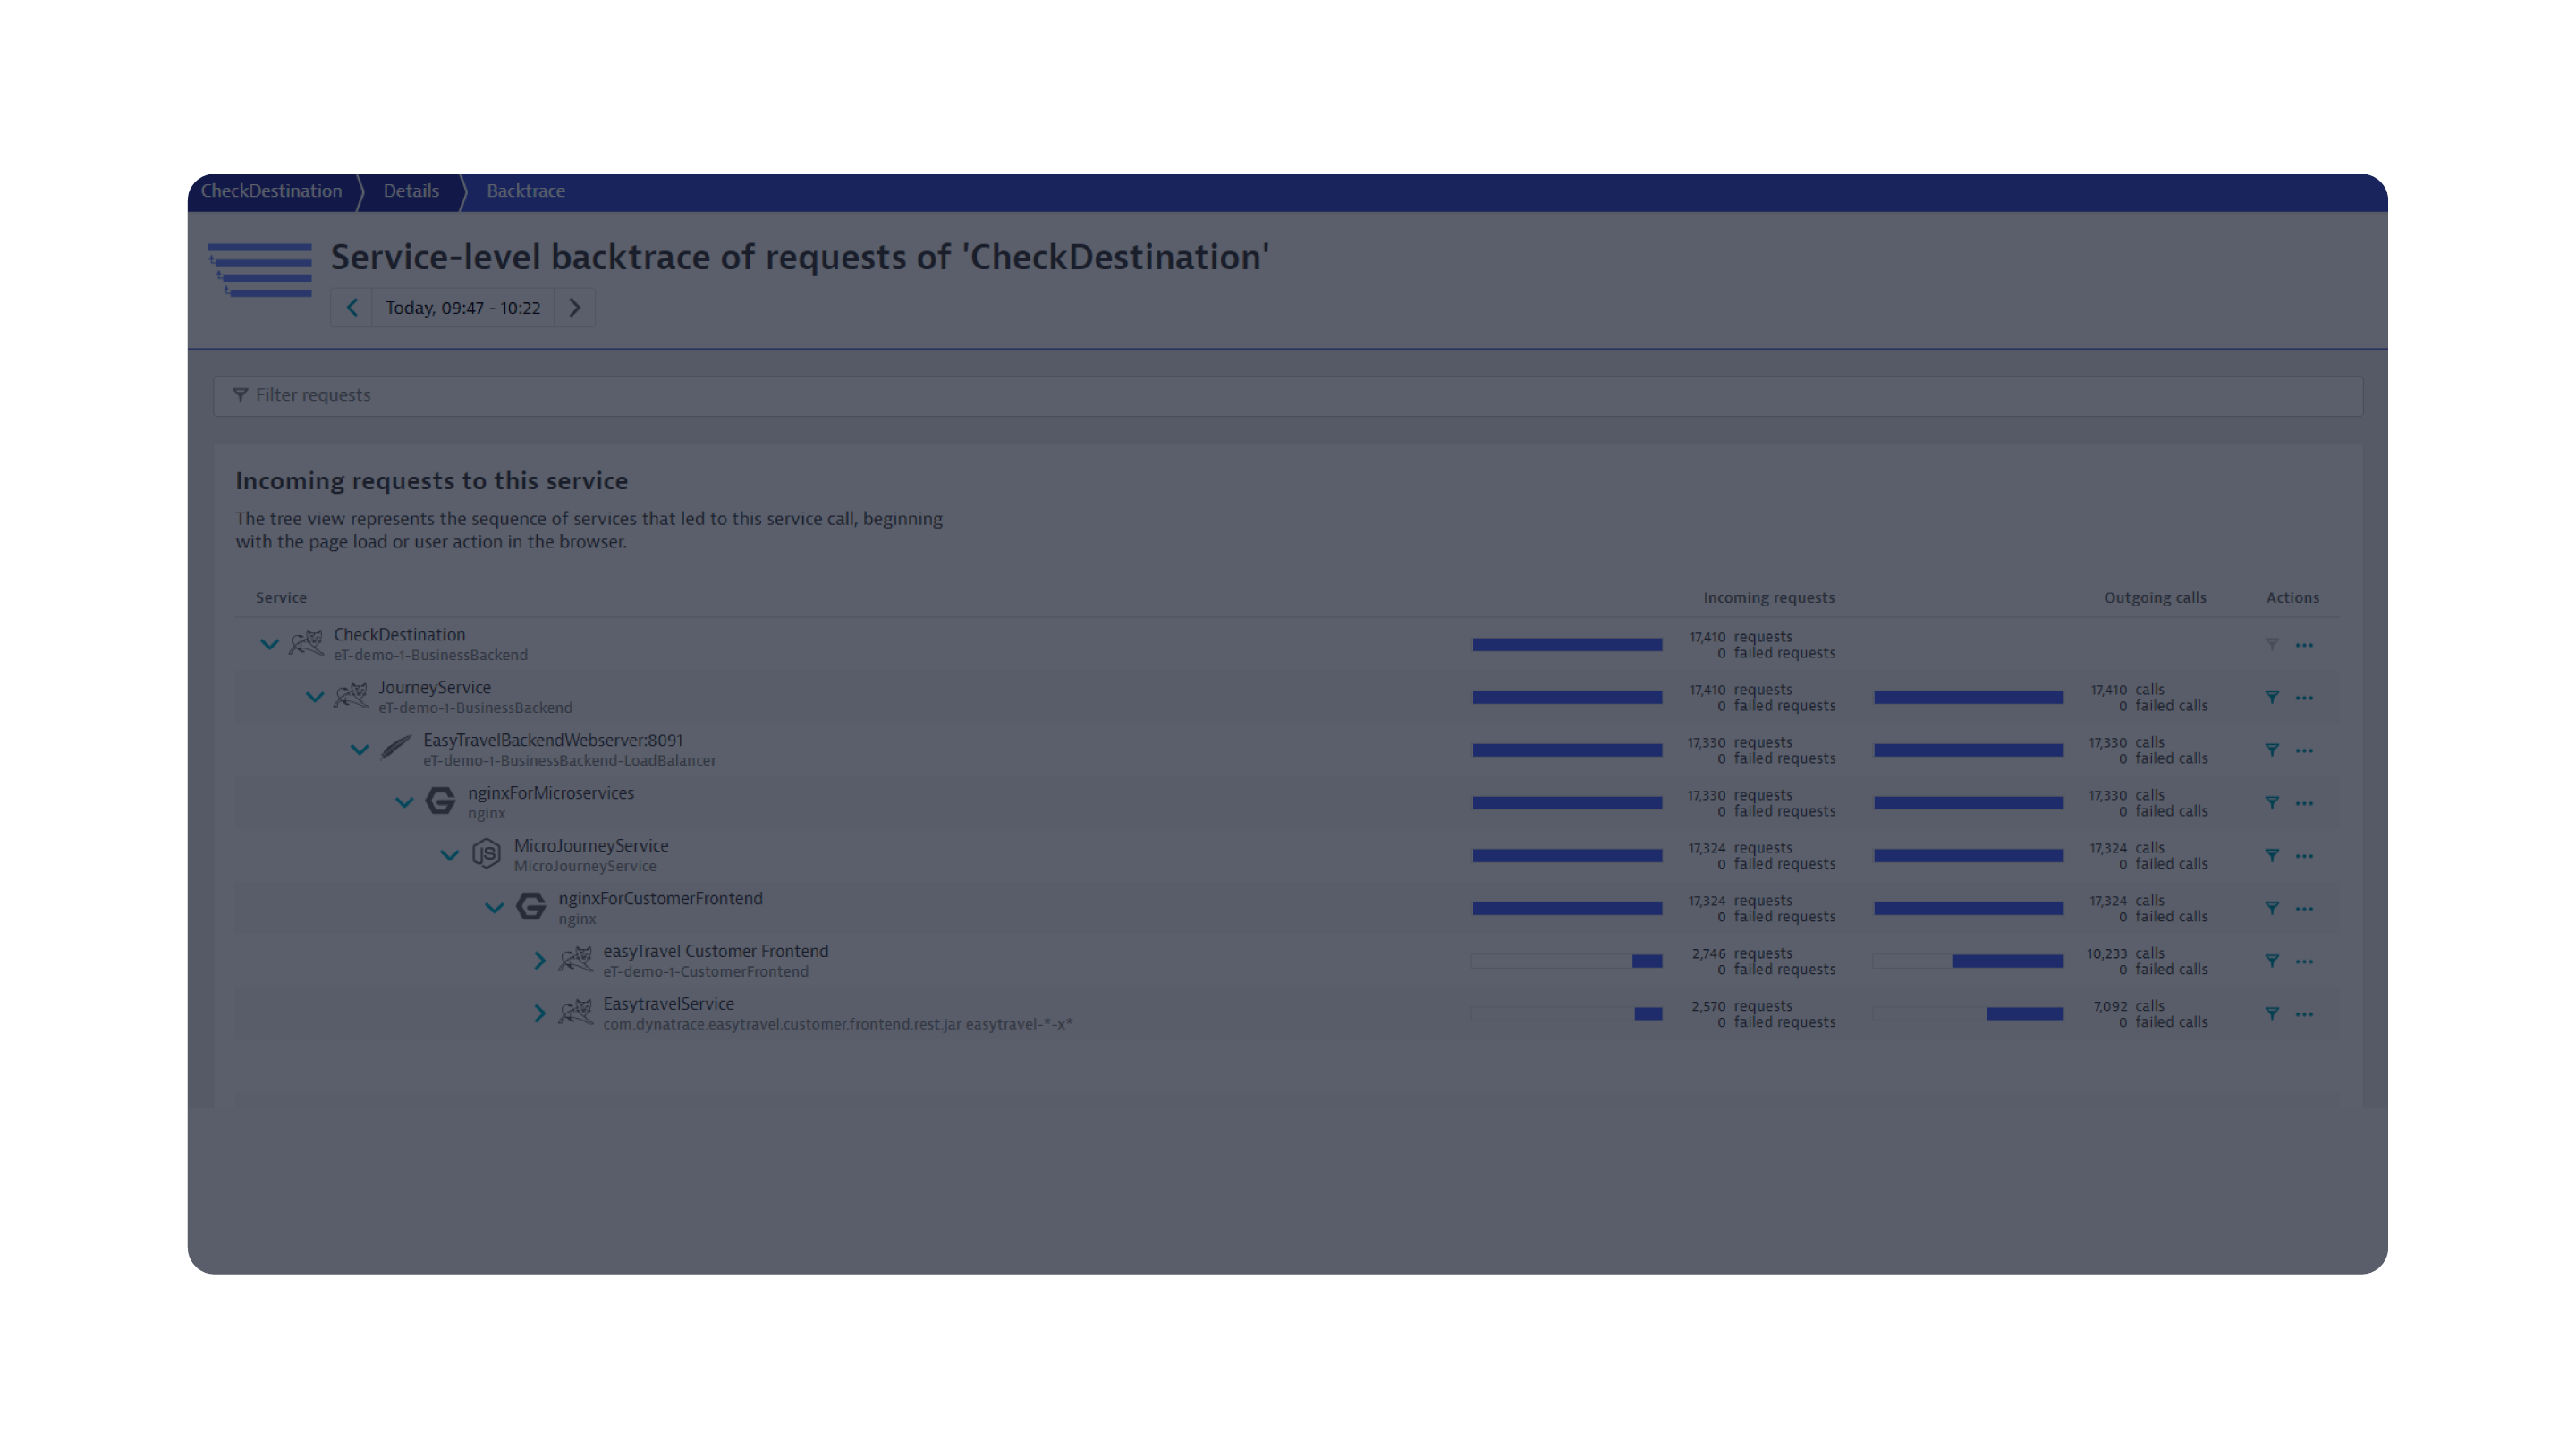
Davis AI automatically analyzes the backtrace, allowing you to proactively address issues before they impact users, leading to better business outcomes. Here, understanding the upstream call chain identifies which frontend services call CheckDestination, reducing risk of other potential issues before they occur.
Proactively identifying issues
Click next to continue exploring the problem impact on this frontend service.
Dynatrace points out that the easyTravel Customer Frontend service is an originator of the call chain.
BACKTRACE
backtrace
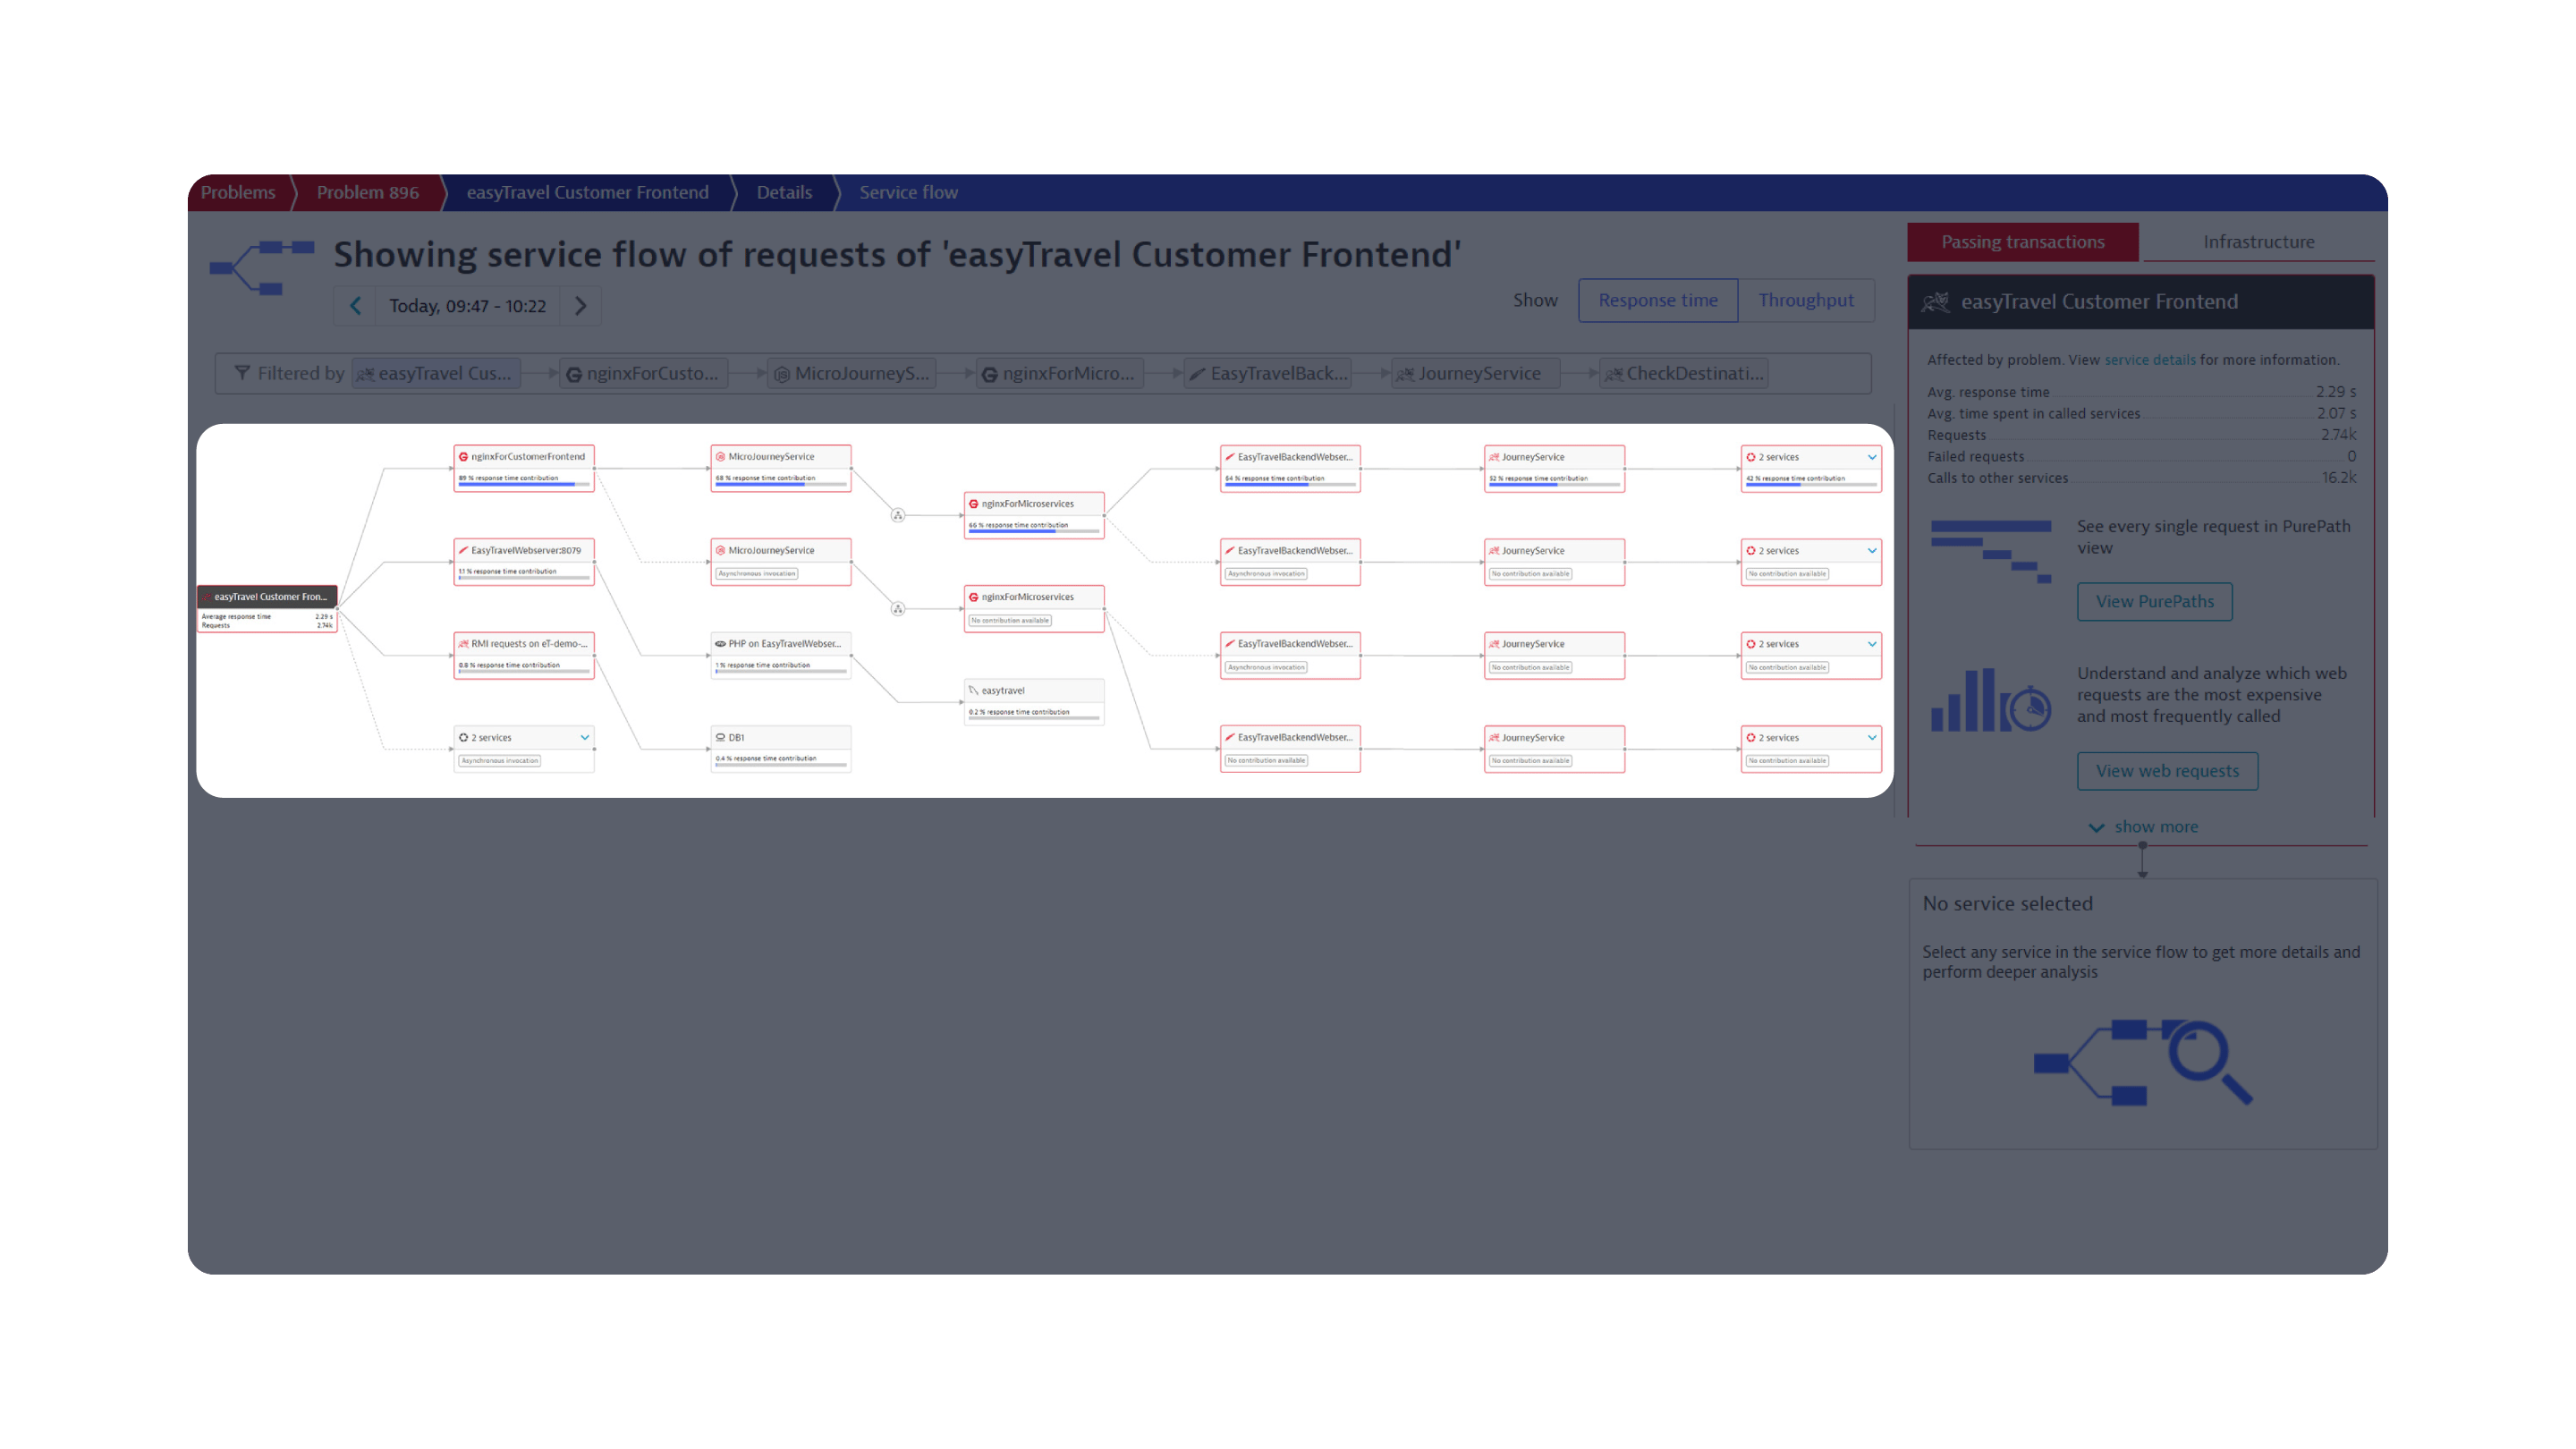
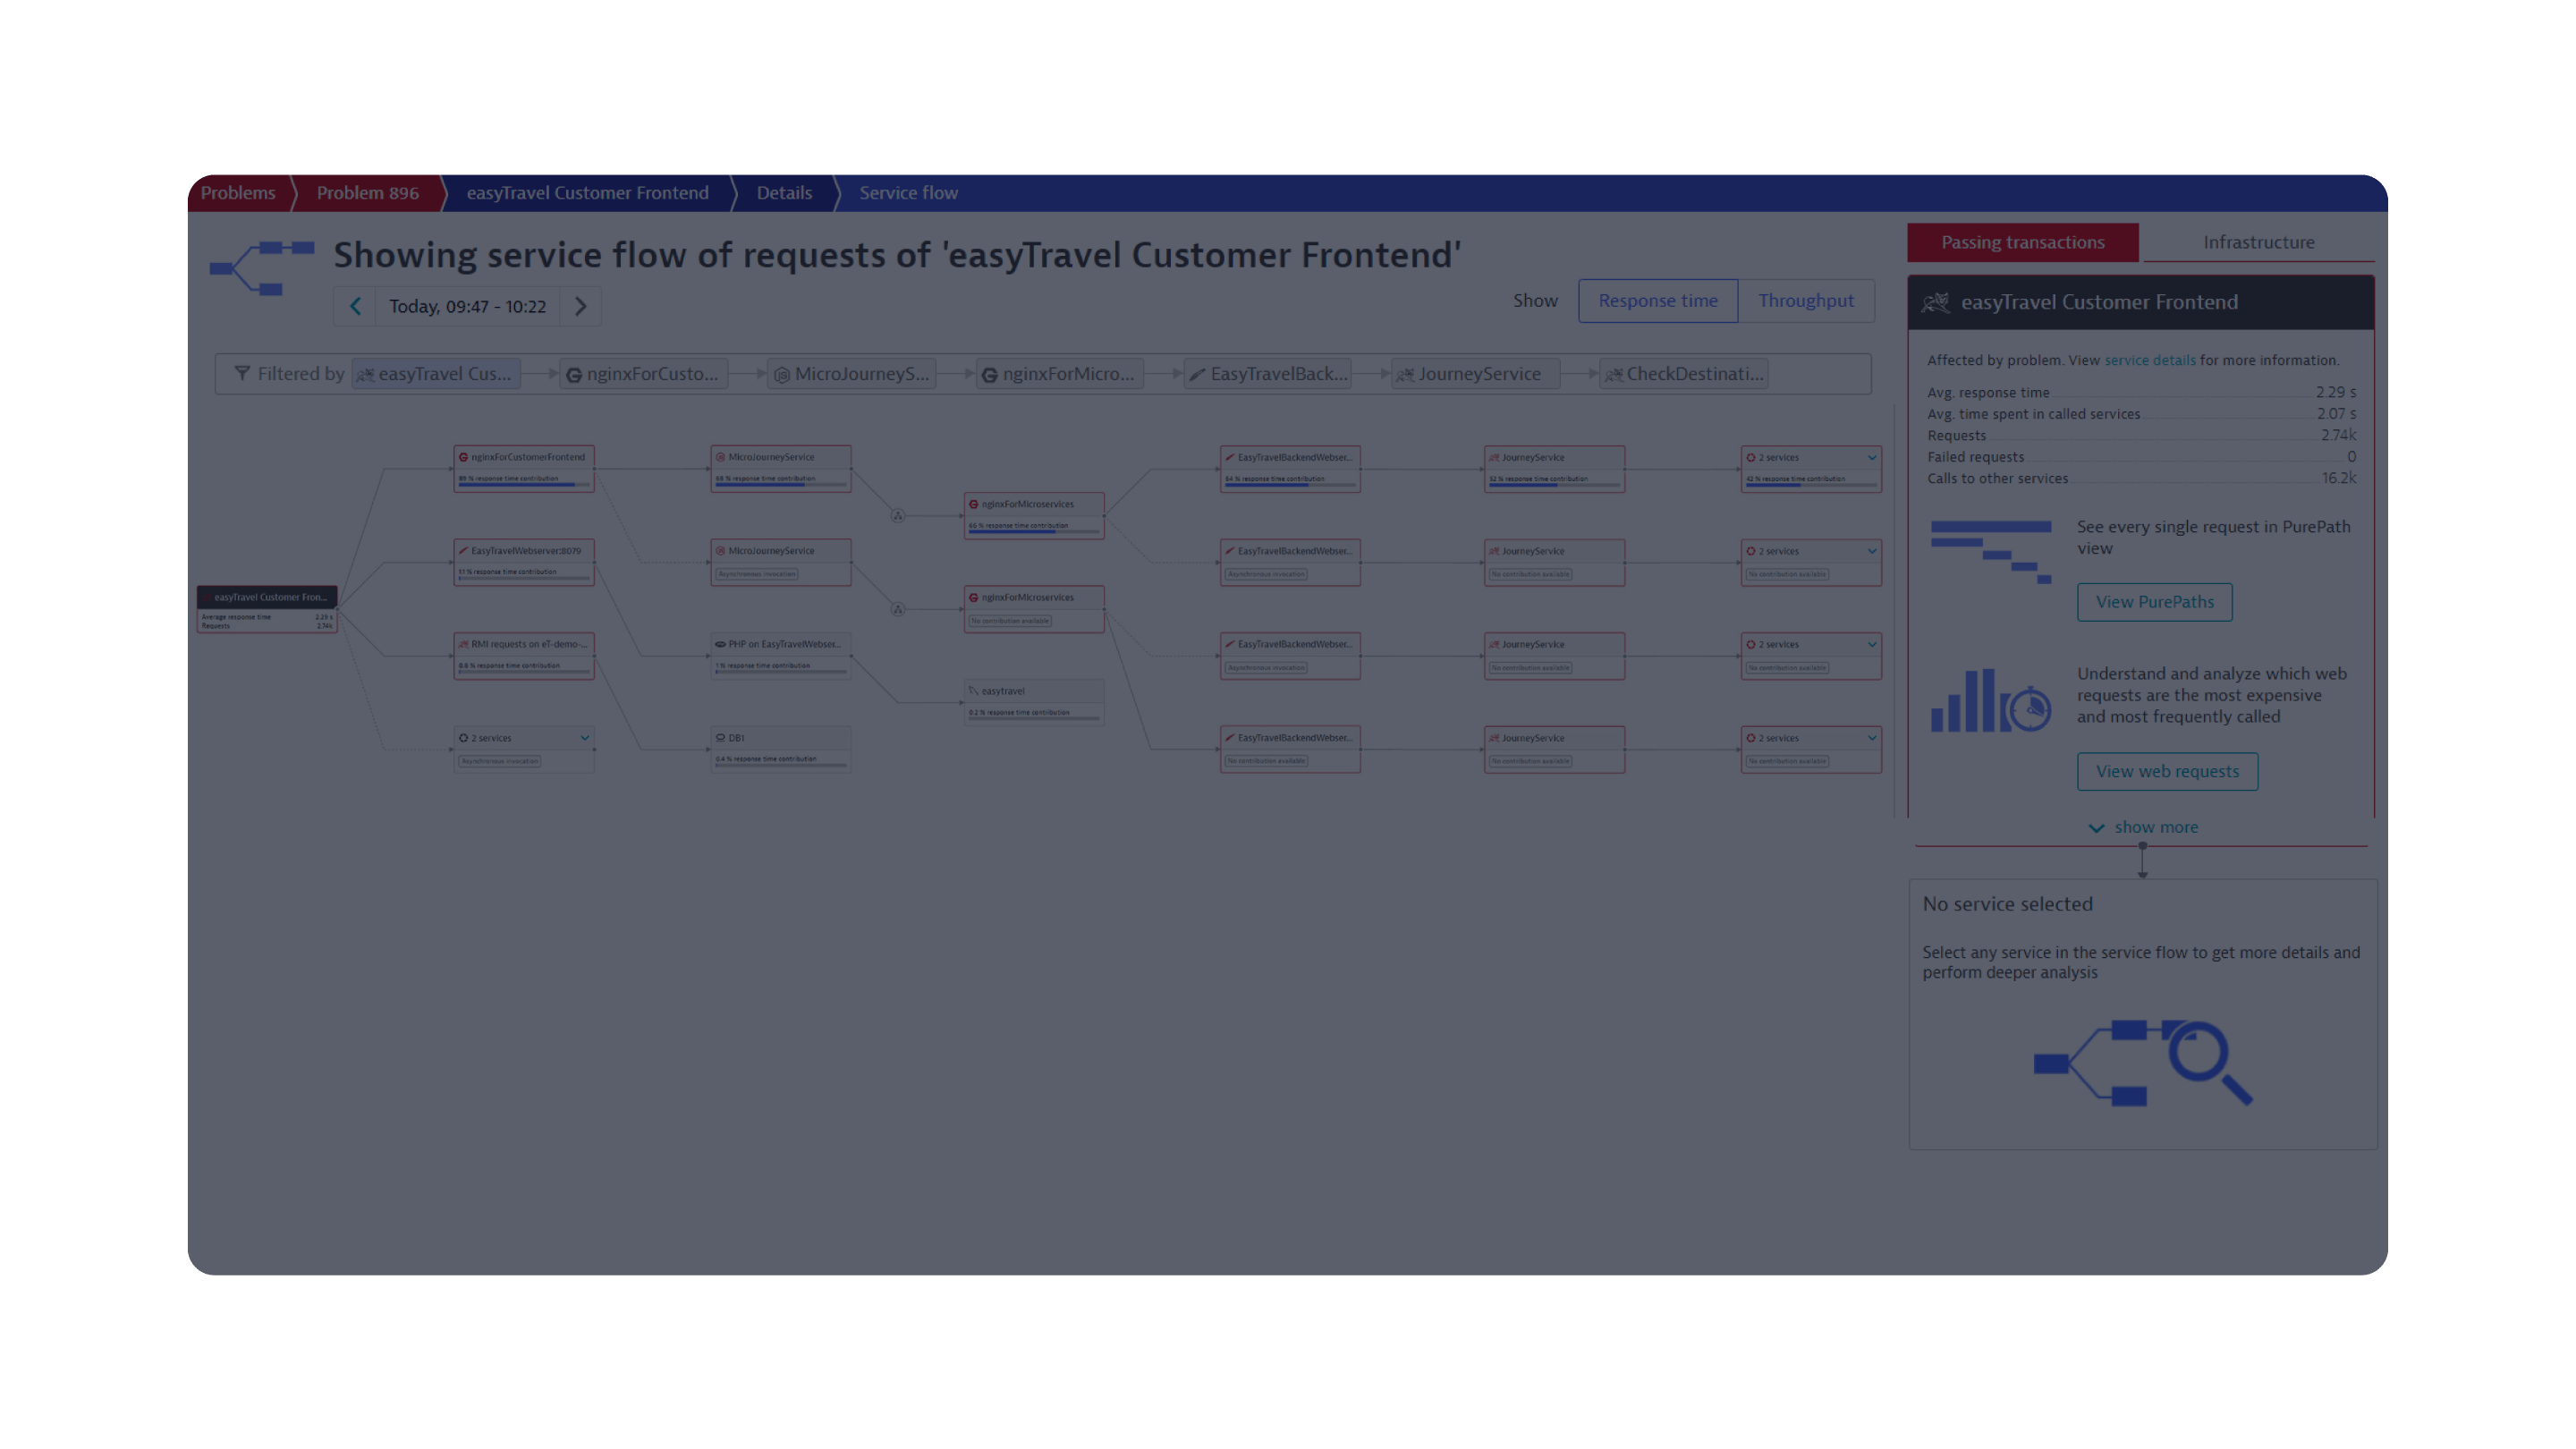
Understanding the relationships between services helps you more effectively troubleshoot and make migration or architecture decisions. Here, we trace the response time degradation through the services down to the CheckDestination service.
Quickly visualizing potential impact areas
Click next to continue explore the PurePath view.
Response time degradation relationships are automatically presented and show links back to the CheckDestination service, and how resolving it will restore normalcy.
SERVICE FLOW
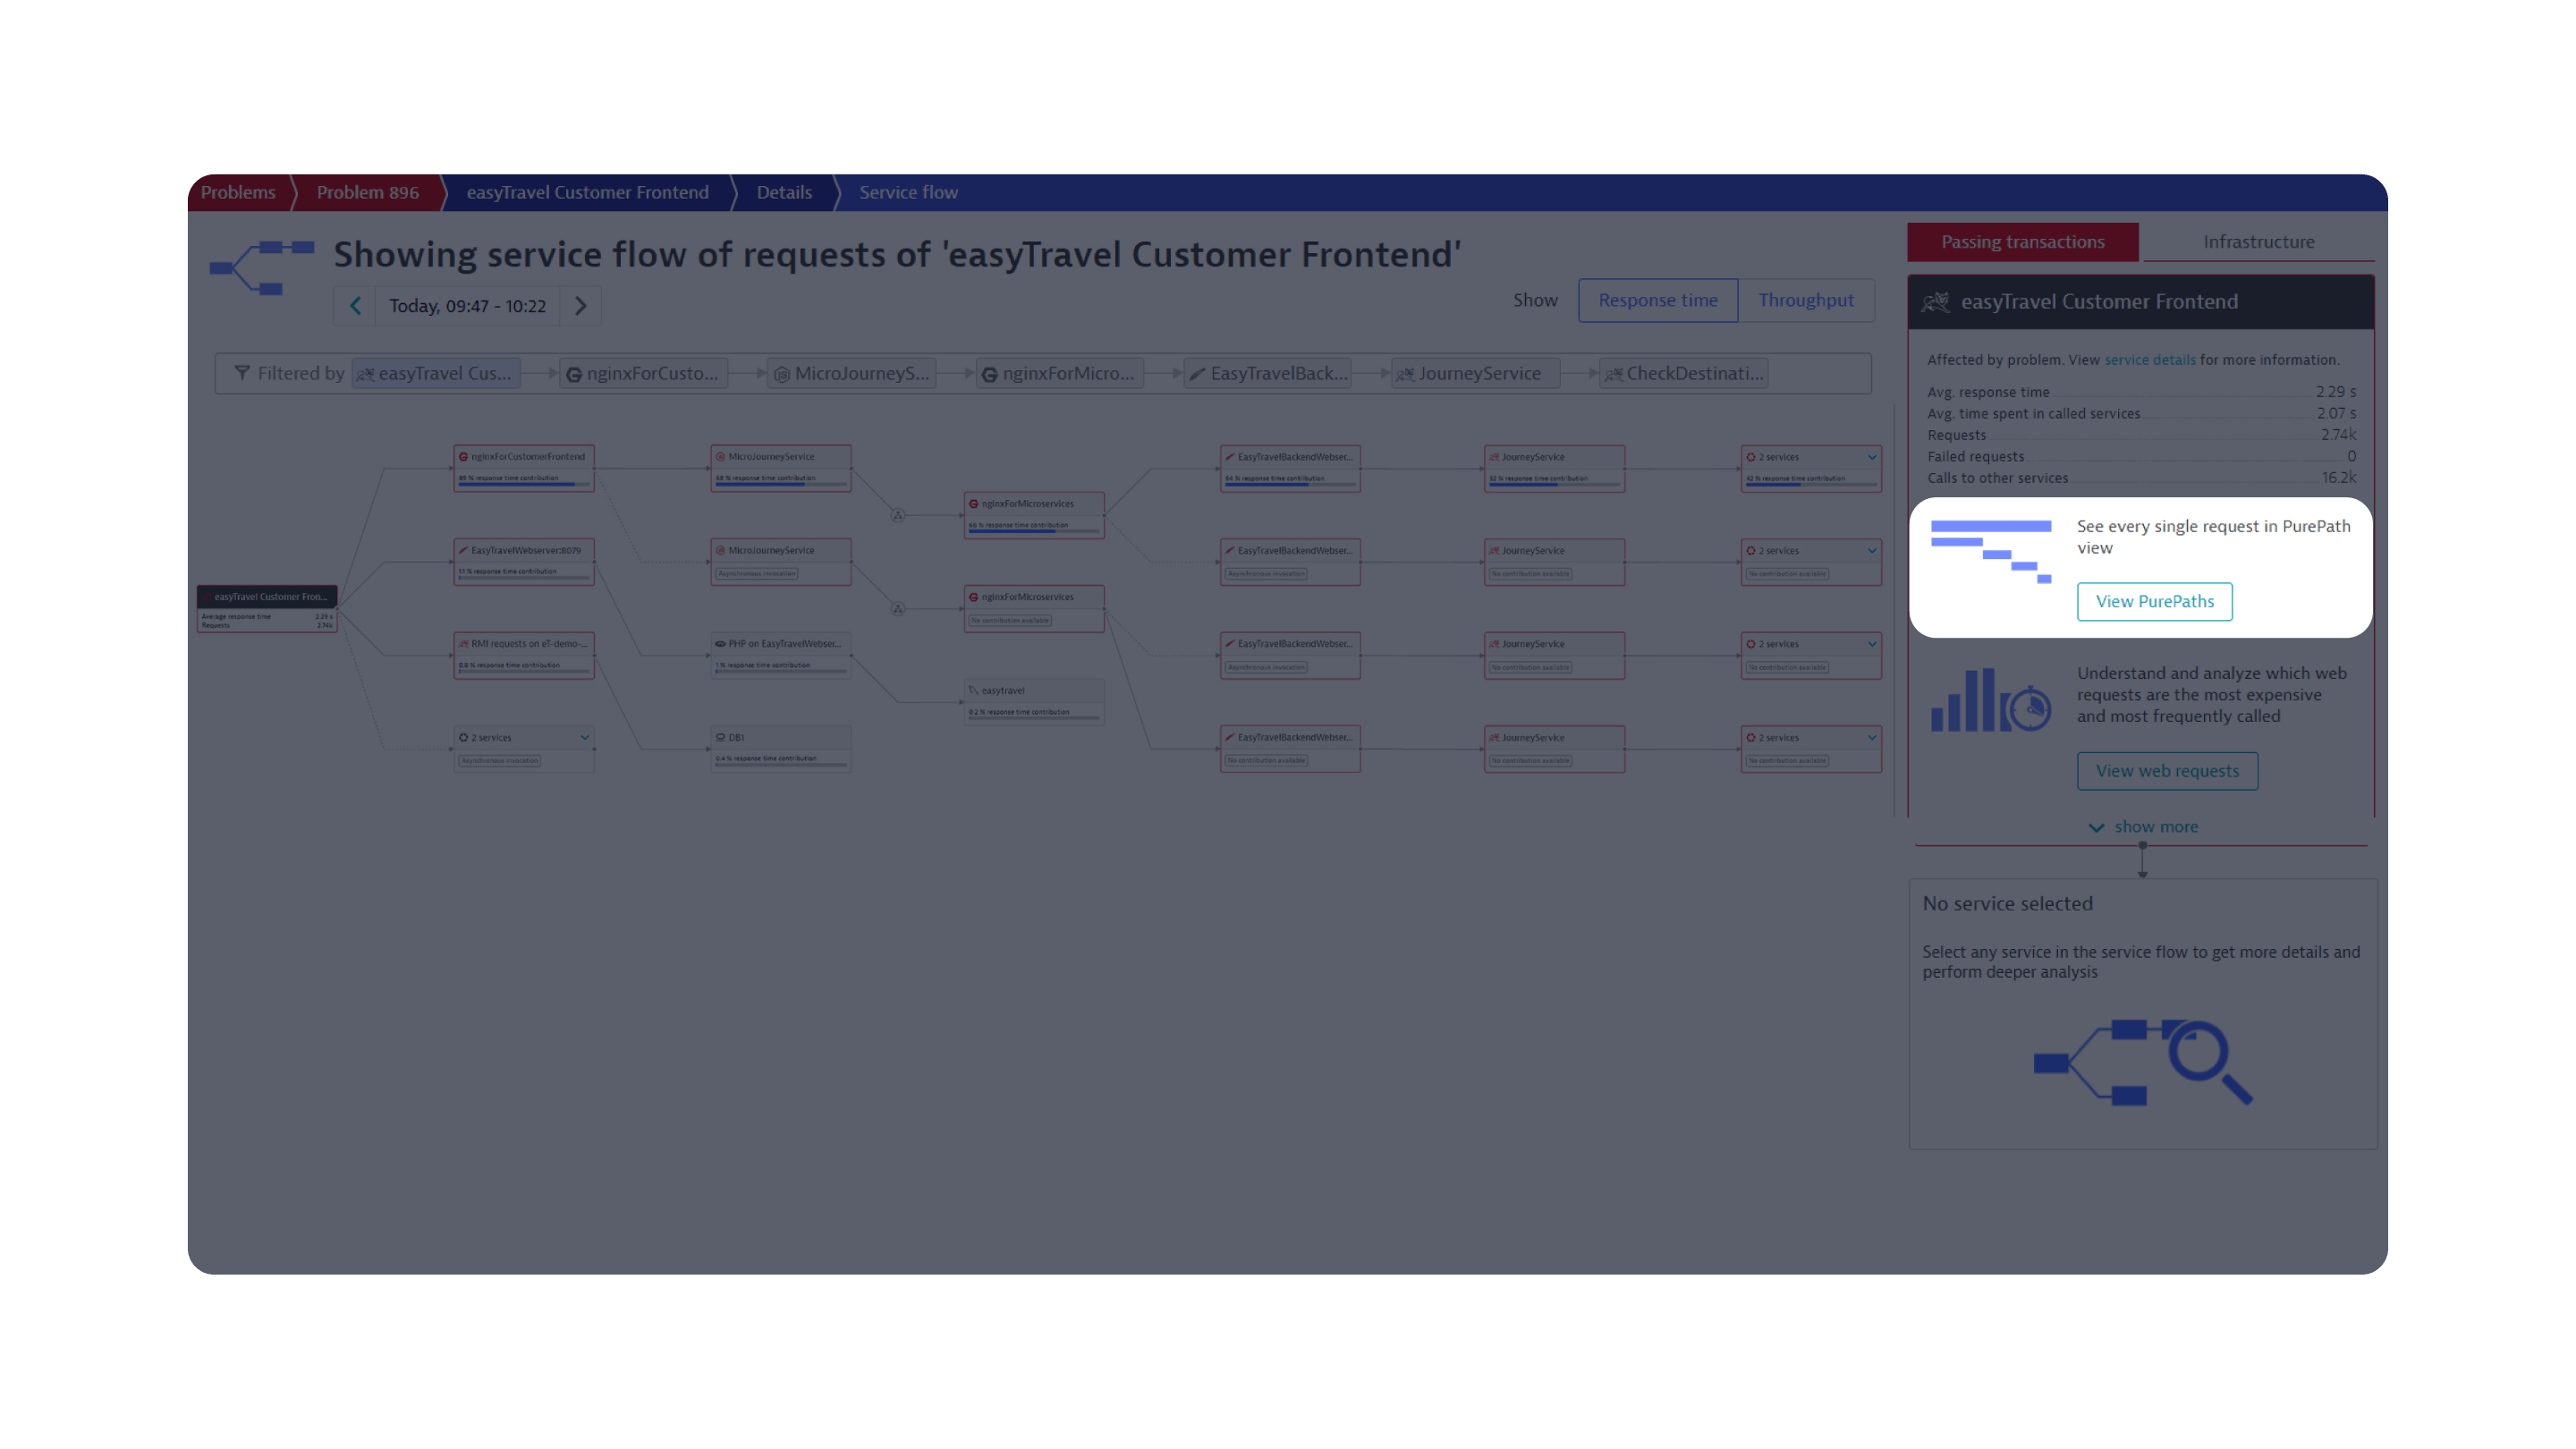
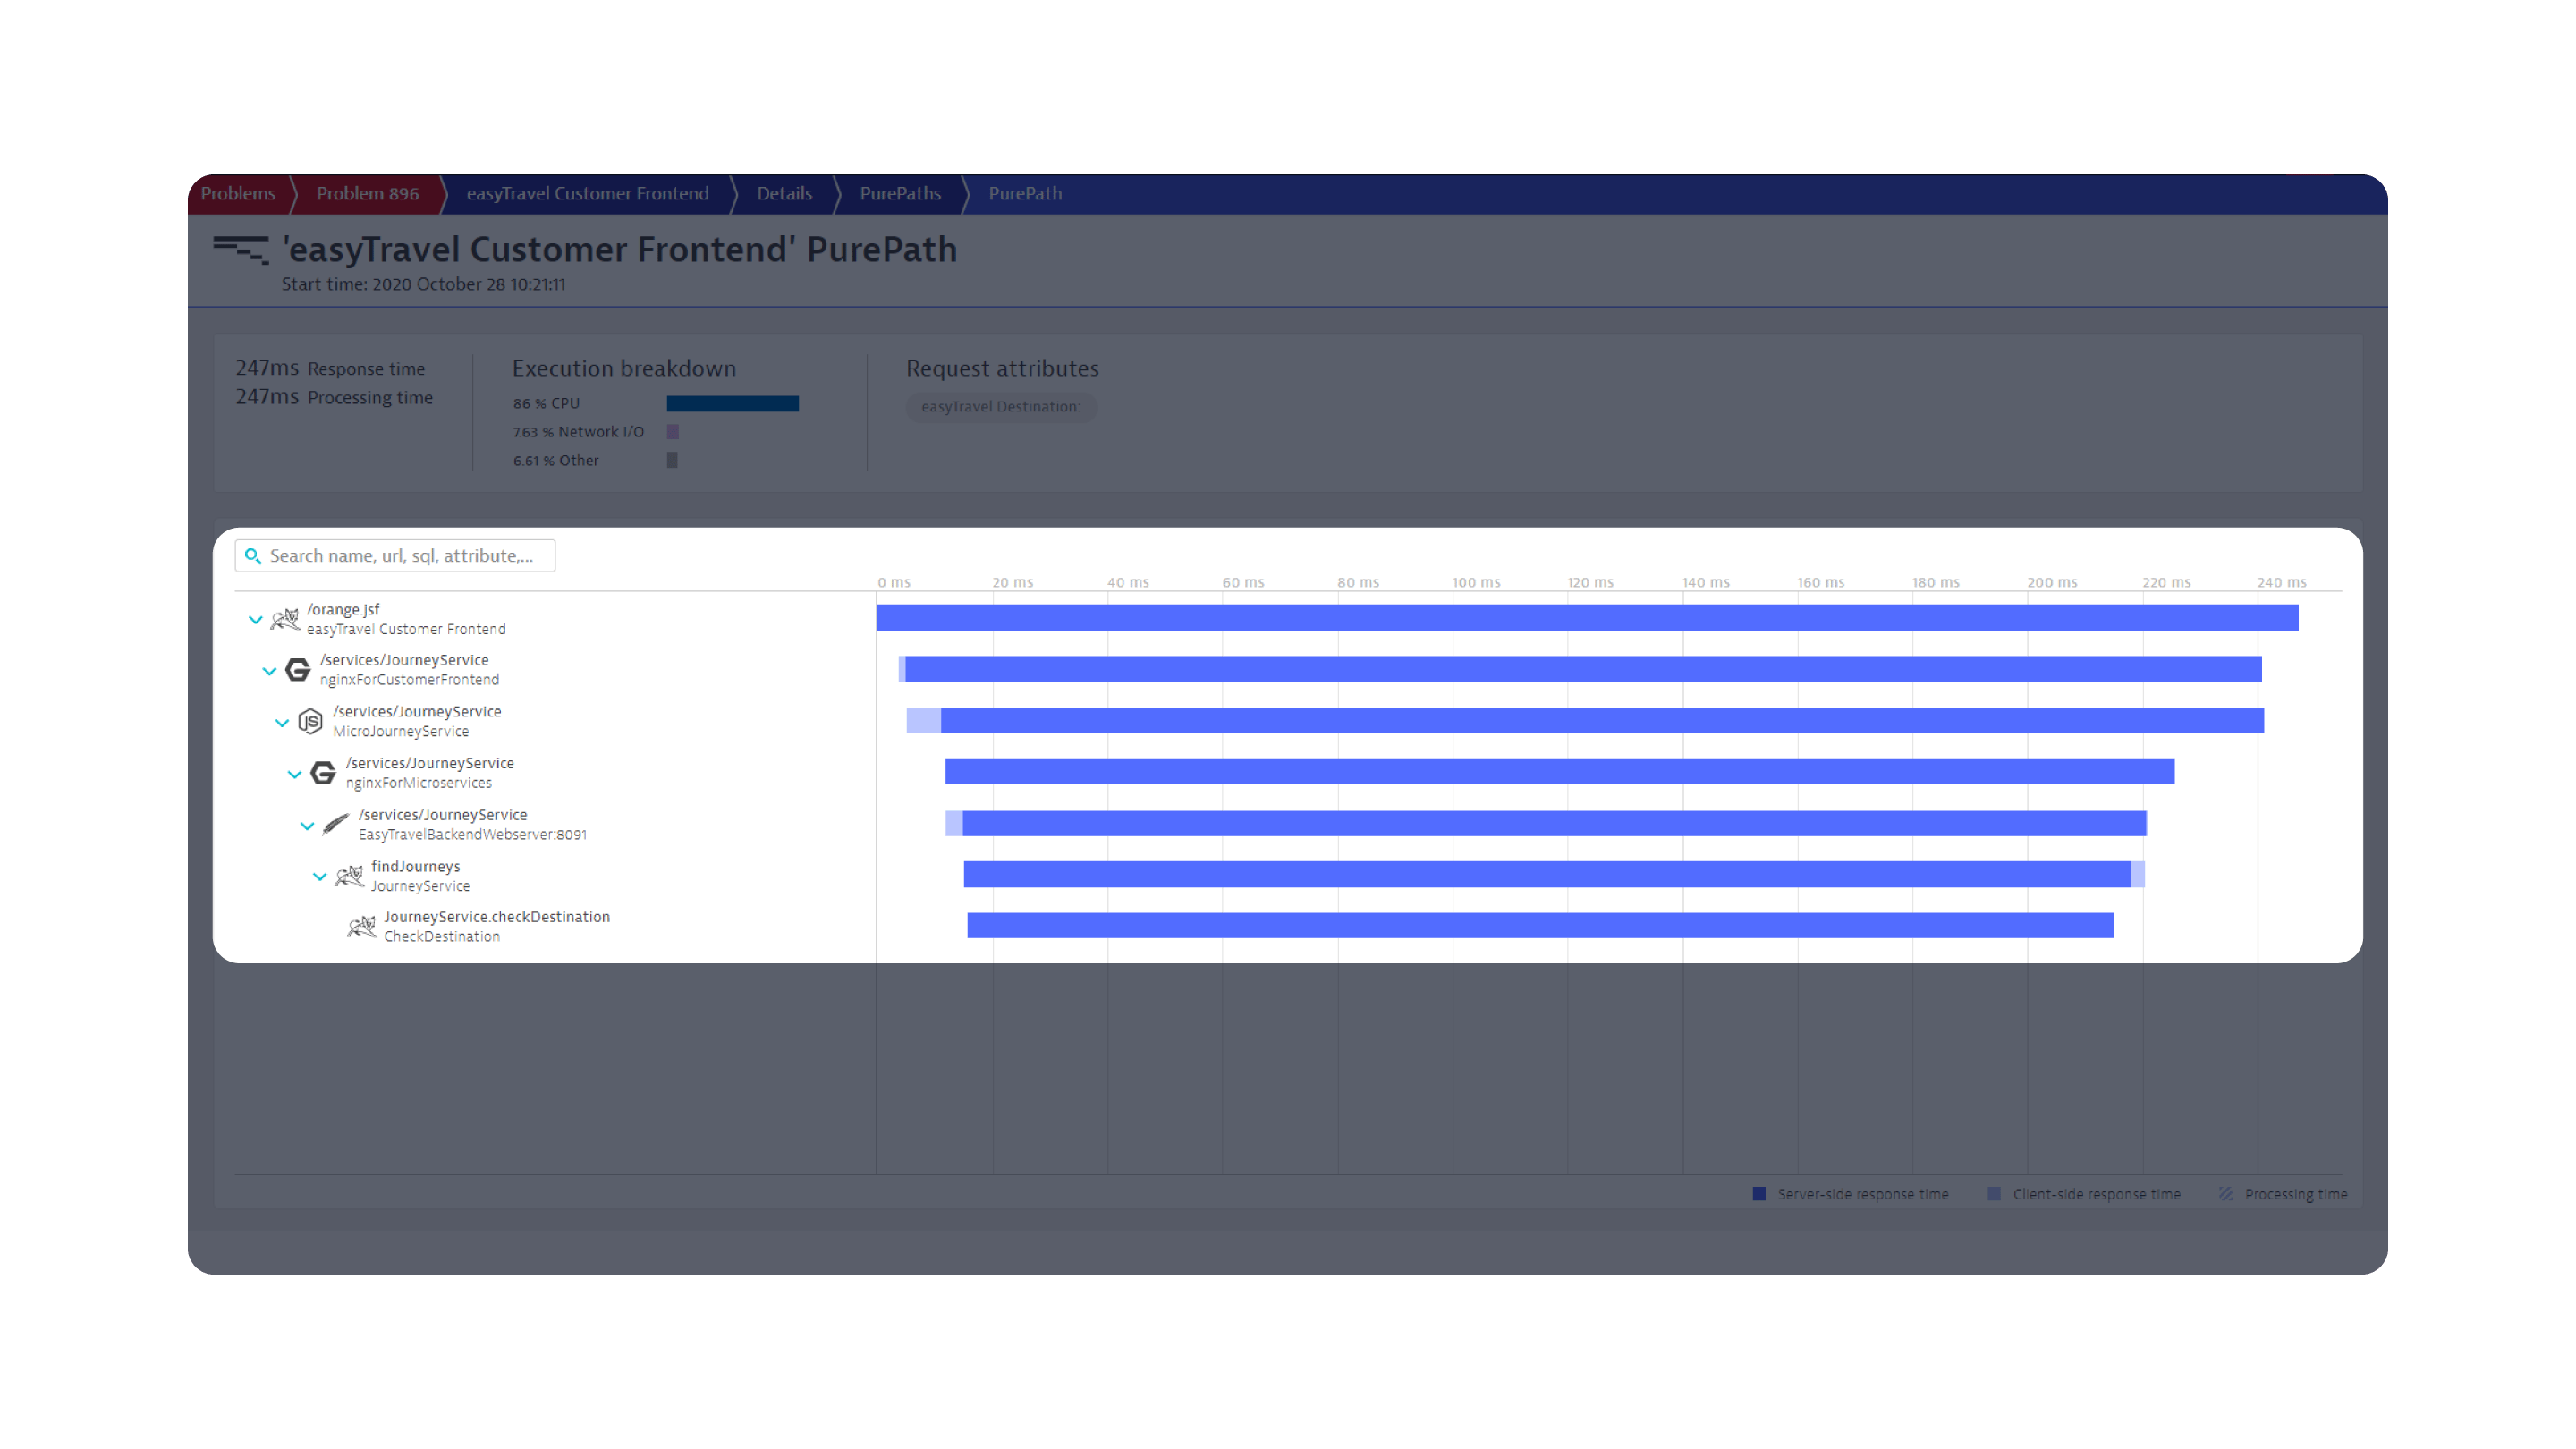
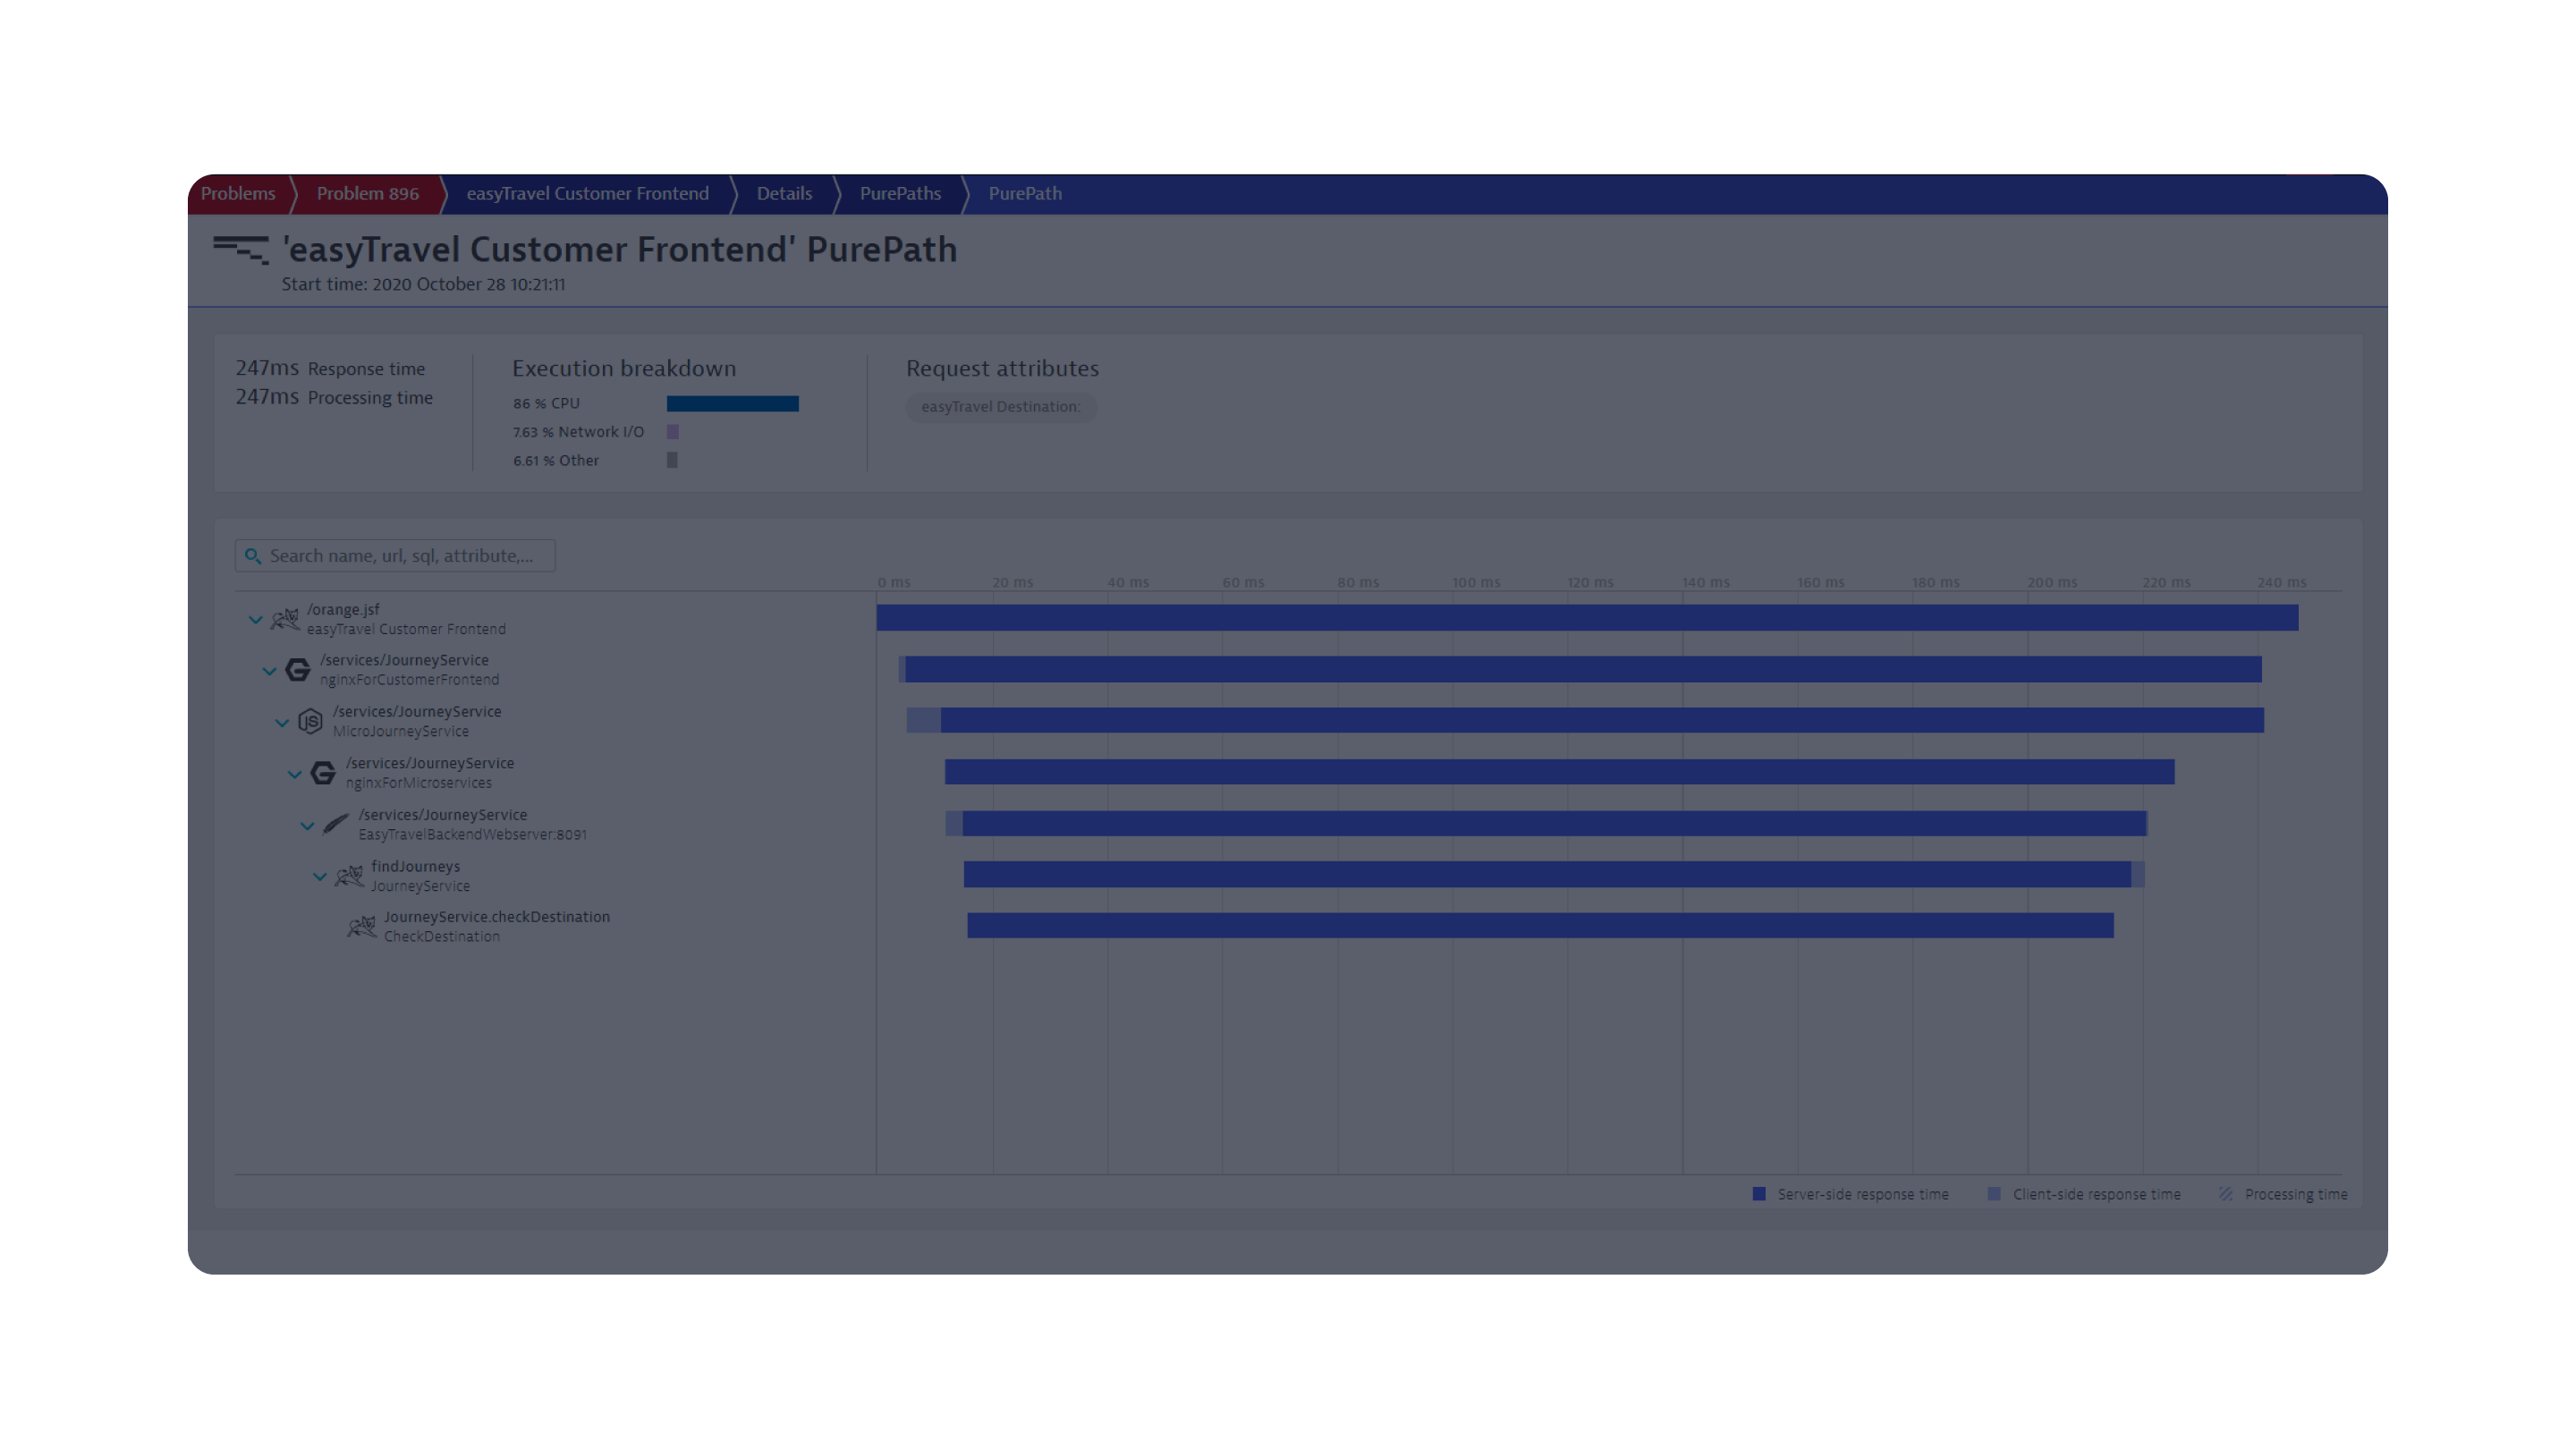
Here, our distributed trace tech, PurePath, gathers data from multiple sources across hybrid and multi-cloud environments to analyze transactions end-to-end across every tier of your application tech stack at scale and without sampling.
Exploring PurePath; distributed tracing with code-level detail
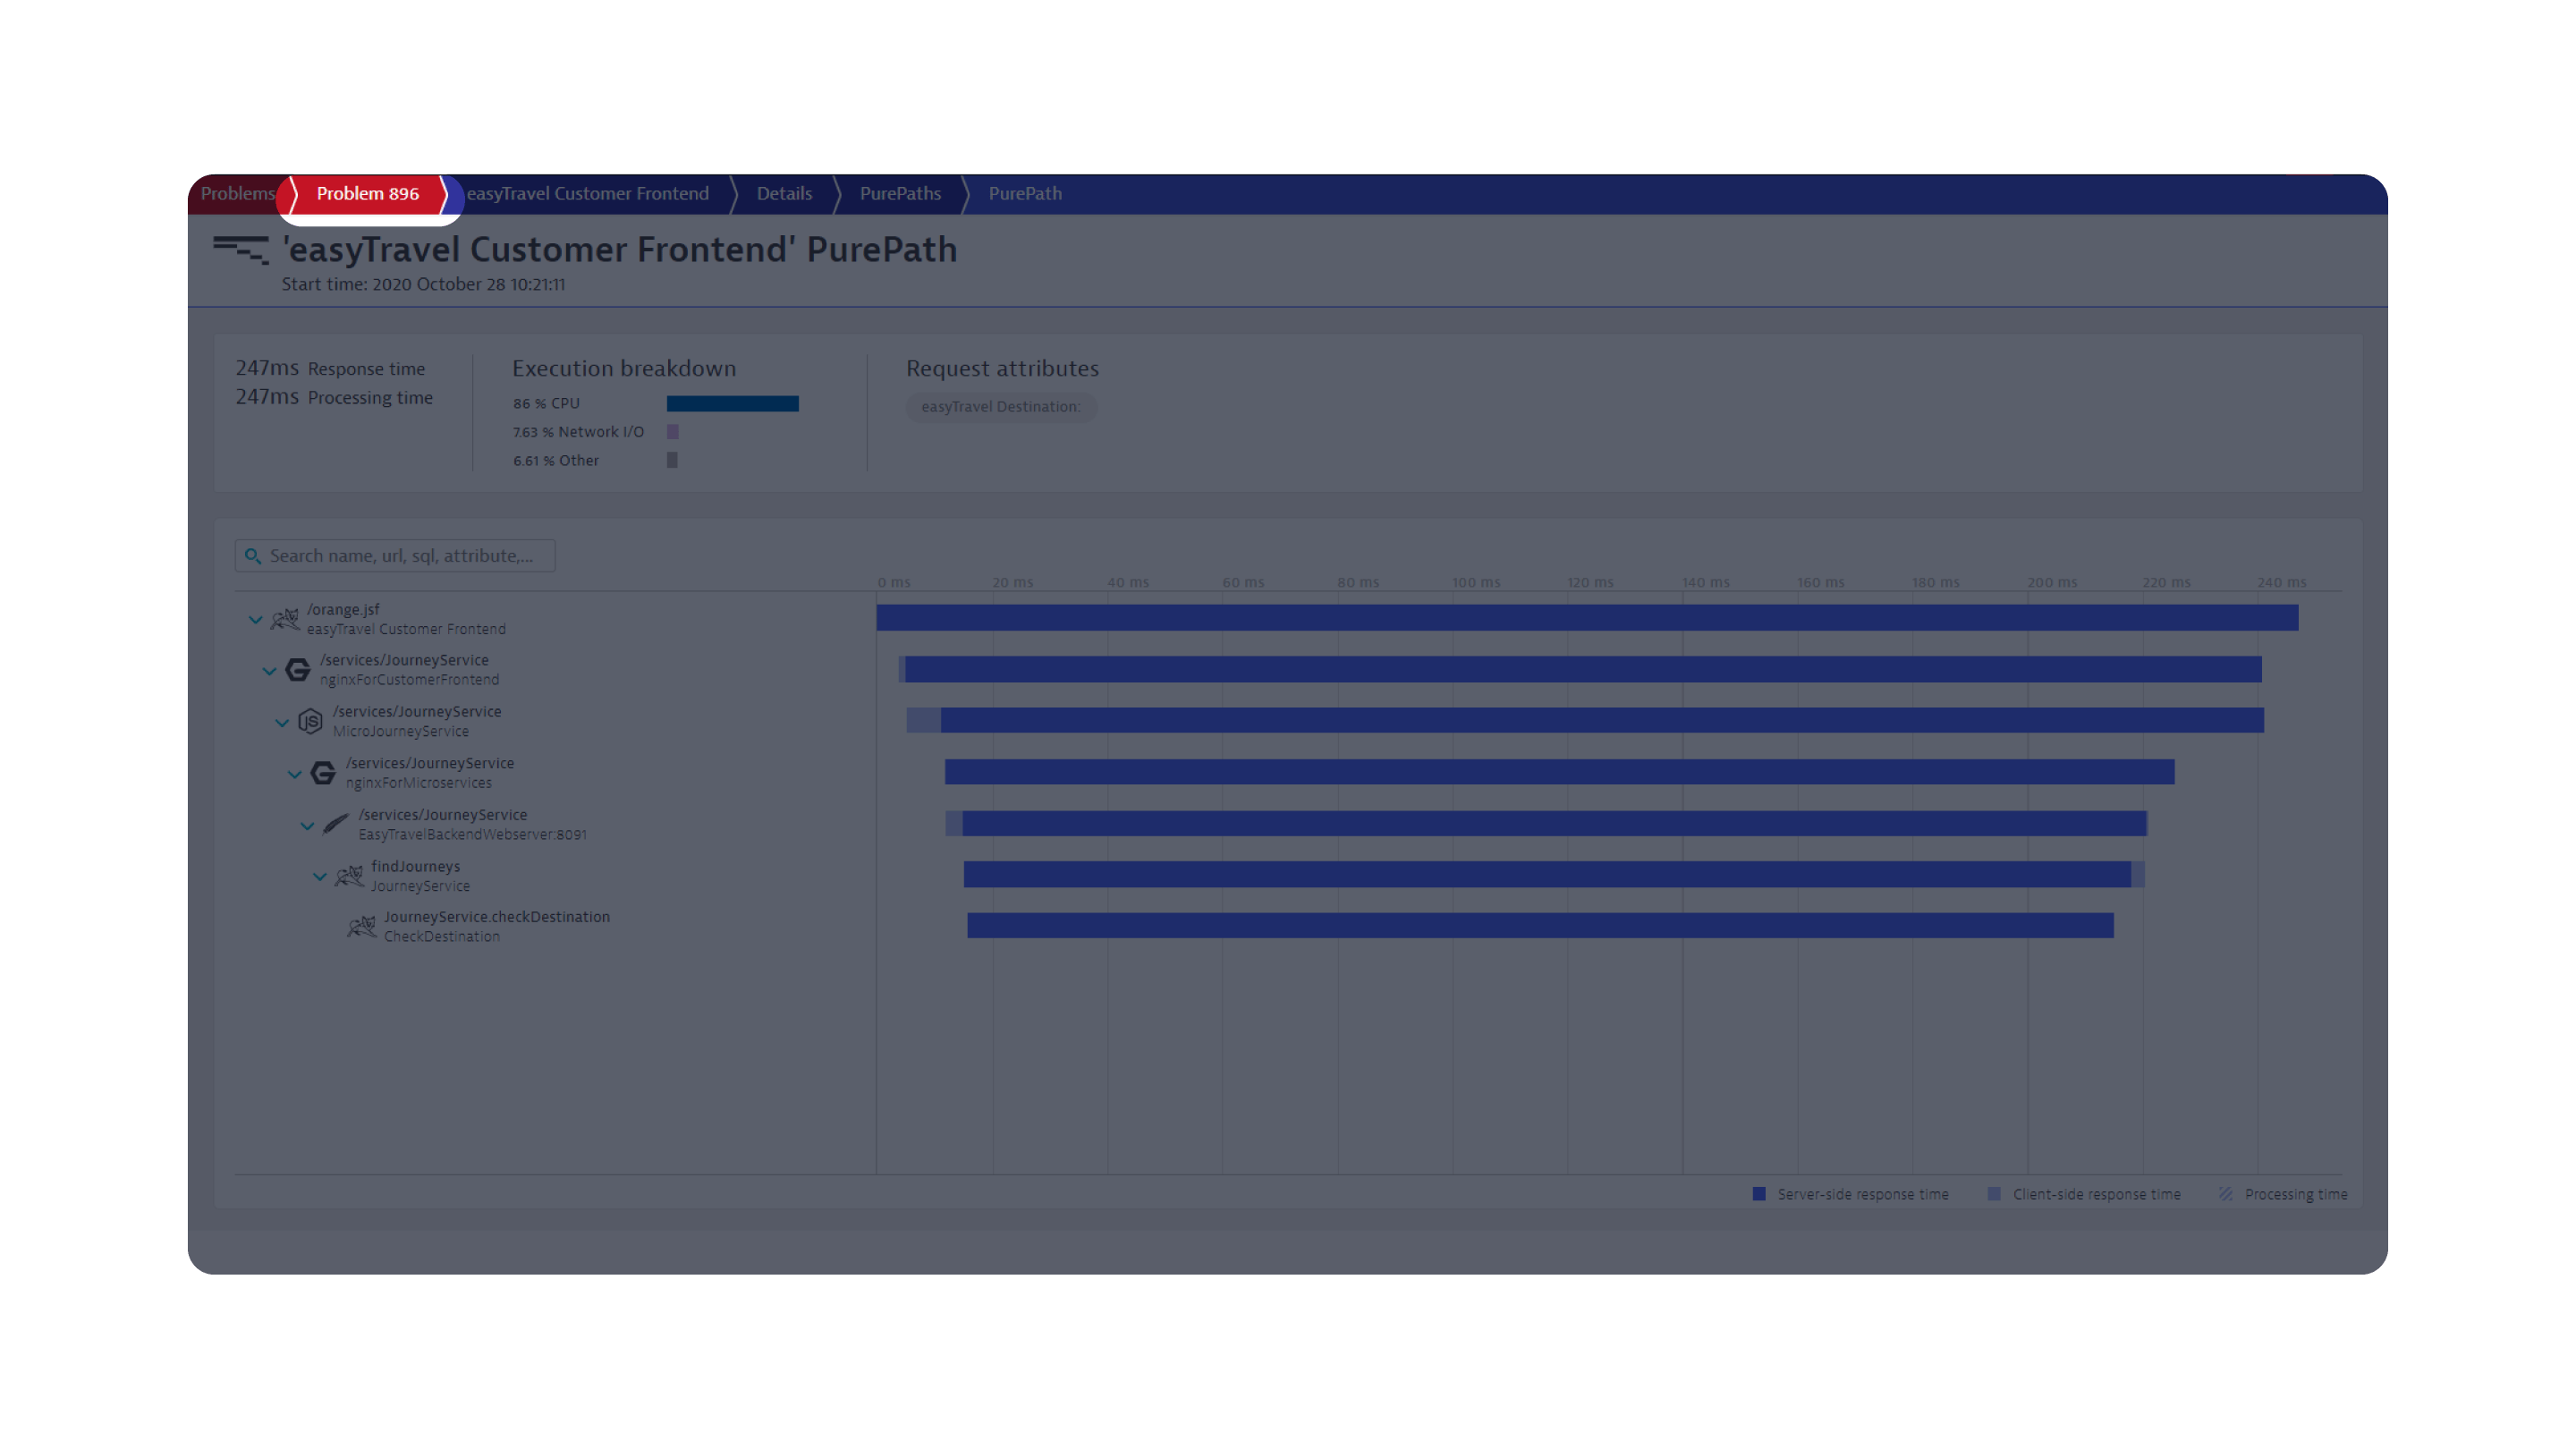
Click next to continue to the problem page and resolve the issue.
A single call path is highlighted to show how the issue lies in the CheckDestination service.
PUREPATH
The Dynatrace platform delivers automatic and intelligent observability for dynamic, multi cloud environments. So, you can stop wasting time and resources manually stitching together data from disparate tools, mitigate risk, speed innovation, and drive better outcomes for your business. Want to see how Dynatrace can radically transform how you work?
Let’s get started
Problem
896
View method hotspots
Precise root cause identification enables Dynatrace to trigger auto-remediation workflows.
1/1
Thank you for your feedback!
or
Did you find this product tour helpful?